
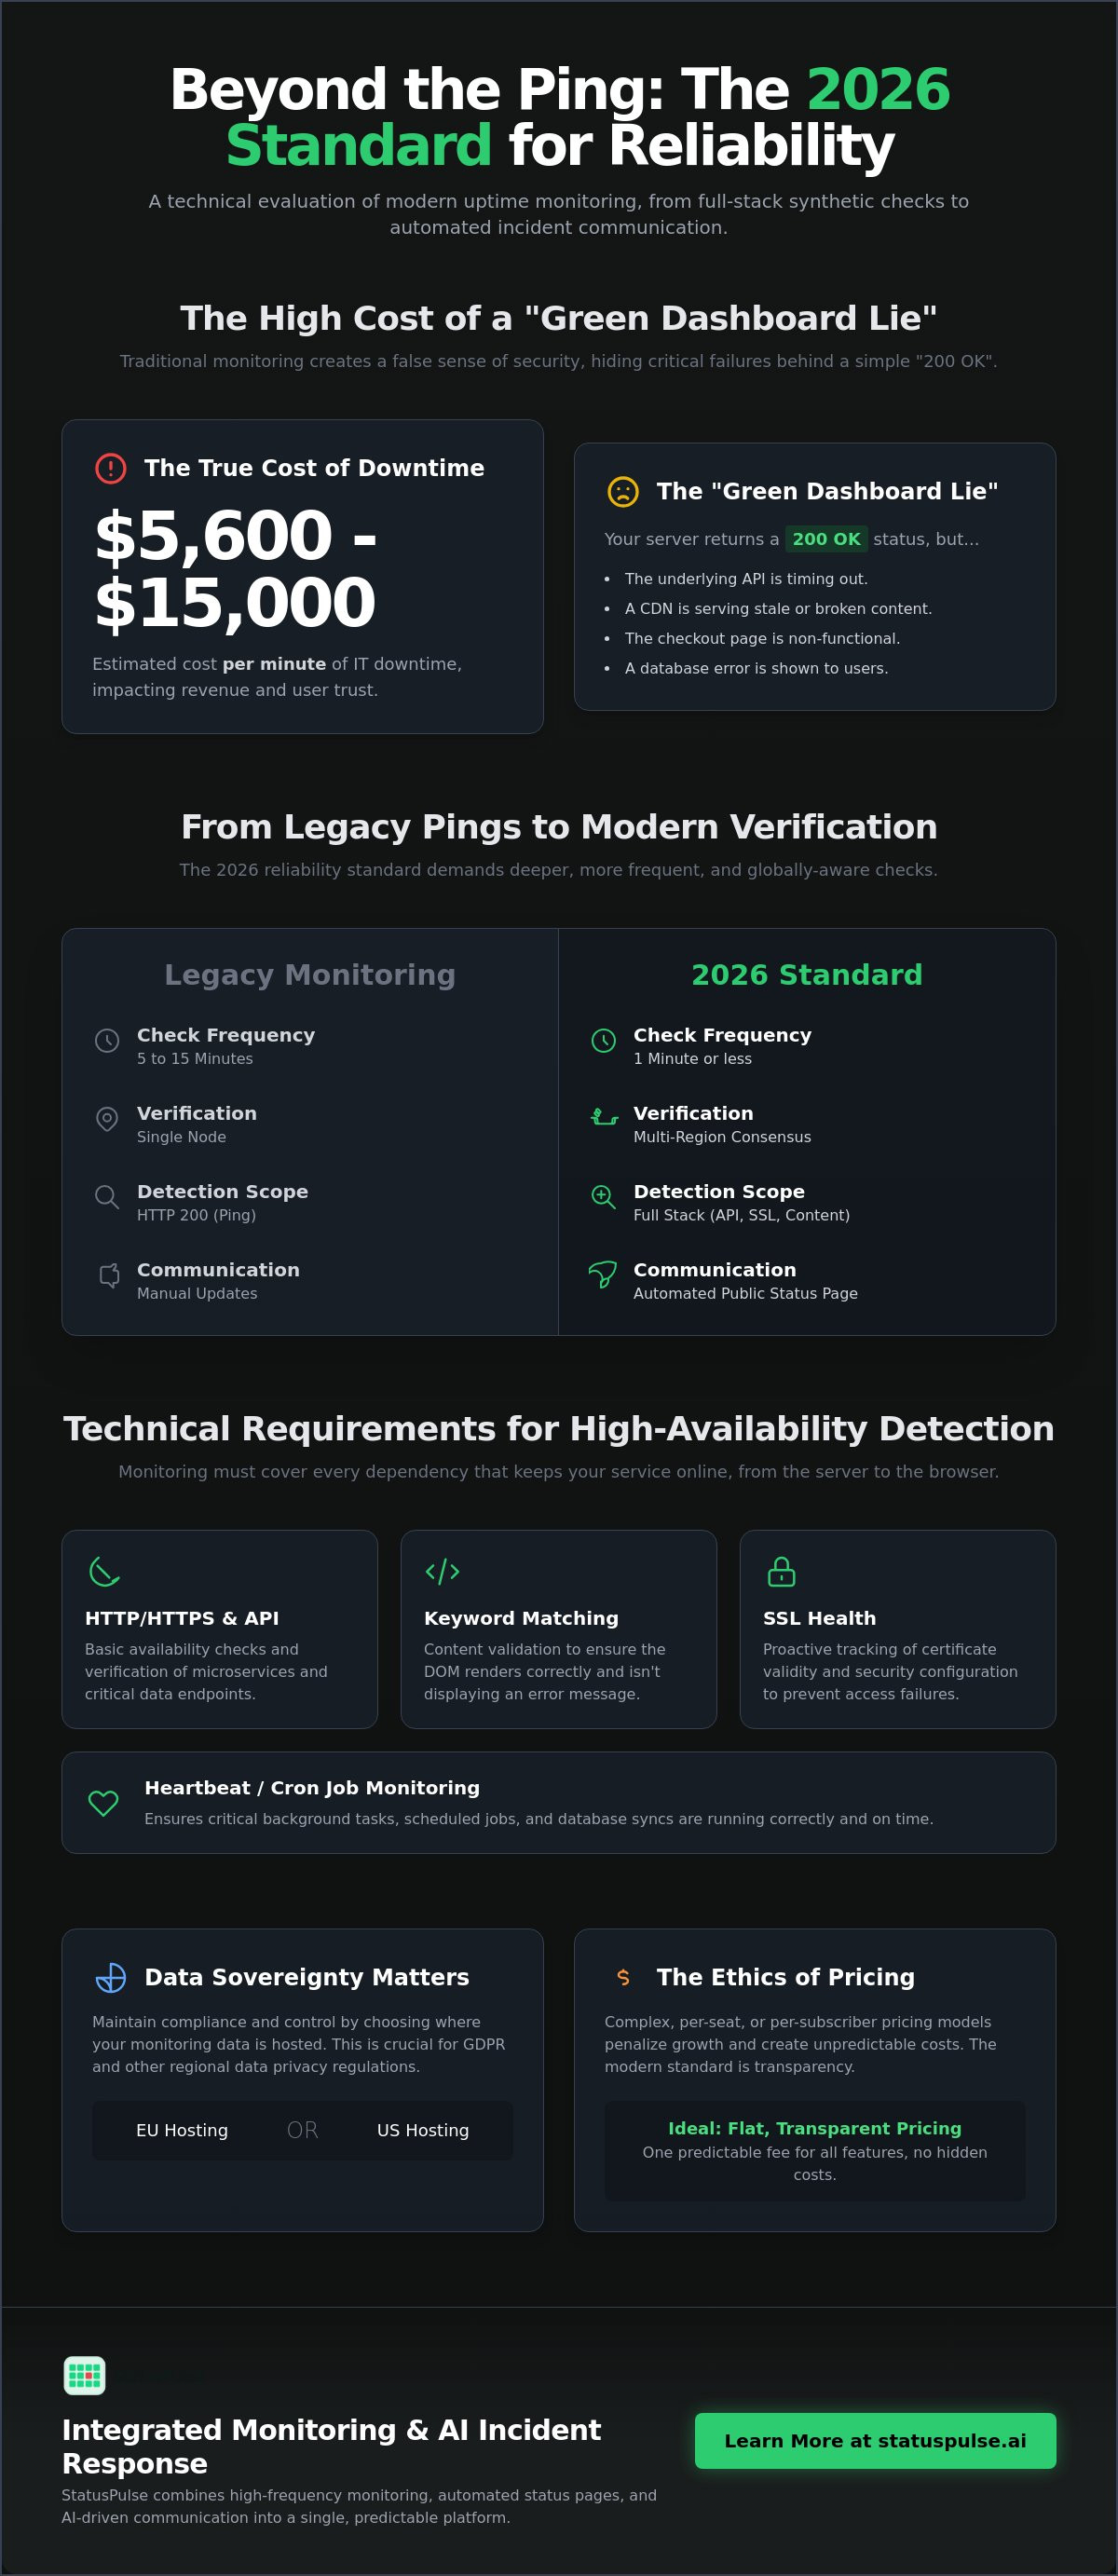
The average cost of IT downtime is estimated between $5,600 and $15,000 per minute, yet many teams still rely on dashboards that stay green while their checkout pages are actually broken. Website uptime monitoring software is a proactive system that verifies the availability and performance of web applications through automated synthetic checks. These tools ensure that endpoints are reachable, SSL certificates are valid, and critical user paths remain functional.
We agree that "up" shouldn't just mean a server is pingable; it must mean the service is actually usable. Monitoring shouldn't be a source of stress or a manual chore involving drafting incident reports during an outage. This guide provides a technical evaluation of modern reliability requirements, focusing on high-frequency 1-minute checks and automated incident communication. We will also examine how to maintain data sovereignty through EU-based hosting and audit the ethical implications of complex pricing models.
Key Takeaways
- Learn why basic HTTP 200 checks fail modern Jamstack and SPA architectures and how to implement a full-stack monitoring strategy.
- Identify the essential features of website uptime monitoring software, including 1-minute check intervals and global synthetic monitoring nodes.
- Understand the impact of data sovereignty on compliance and the benefits of choosing between EU and US hosting for your monitoring data.
- Evaluate the true cost of monitoring by comparing transparent flat pricing models against complex per-subscriber or per-seat licensing.
- Streamline your incident response by integrating automated status pages and AI-driven updates to reduce manual overhead during outages.
Beyond Up/Down: Why Traditional Monitoring Fails Modern Stacks
Modern web architectures have outpaced the capabilities of legacy ping tools. Website monitoring has evolved from simple availability pings to complex functional verification. In modern environments, a server can be reachable while the application is fundamentally broken for the user. Relying on basic checks creates a false sense of security that results in undetected downtime.
| Requirement | Legacy Monitoring | 2026 Standard |
|---|---|---|
| Check Frequency | 5 to 15 Minutes | 1 Minute or less |
| Verification | Single Node | Multi-Region Consensus |
| Detection Scope | HTTP 200 (Ping) | Full Stack (API, SSL, Content) |
| Communication | Manual Updates | Automated Public Status Page |
For developers managing SPAs or Jamstack sites, an HTTP 200 status code on the index page is often a "green dashboard lie." If the underlying API is timing out or the CDN is serving stale content, your website uptime monitoring software must be able to detect these partial failures. Honest monitoring acknowledges that uptime is a gradient. It requires looking past the surface to verify that the application logic is actually rendering correctly for the end user.
The Technical Debt of Fragmented Monitoring
Fragmented monitoring creates observability silos that slow down incident response. When SSL tracking, API checks, and uptime alerts live in separate tools, teams waste critical minutes correlating data during an outage. This fragmentation increases your Mean Time to Recovery (MTTR) and complicates the post-mortem process. Manual status page updates usually lag behind reality, which damages user trust when the dashboard reports "All Systems Operational" during a known service blackout.
Defining the 2026 Reliability Standard
The 2026 reliability standard requires 1-minute check intervals as the absolute baseline for production environments. Anything slower allows significant downtime to slip through the cracks unnoticed. Multi-region verification is also necessary to distinguish between local network blips and global outages. By requiring consensus from at least two geographic nodes before firing an alert, teams can effectively eliminate false positives.
SSL certificate monitoring is no longer an optional add-on for web services. An expired certificate is a preventable failure that halts all incoming traffic, making integrated tracking a core requirement for modern operations. At StatusPulse, we focus on providing this level of precision to ensure your monitoring reflects the actual user experience rather than just server availability. Integrated incident communication ensures that detection and notification happen as a single, automated workflow.
Technical Requirements for High-Availability Detection
High-availability detection requires more than a simple ping. Modern website uptime monitoring software must simulate complex interactions to identify failures that a basic handshake misses. This process involves synthetic monitoring, which is the simulation of user paths to verify functional uptime. By mimicking a real browser or a client request, you can catch performance regressions before they impact actual customers.
Keyword monitoring serves as a critical content validation layer. Even if a server returns a 200 OK status, the page might be blank or display a database connection error. By searching for a specific string on the page, like "Login" or "Dashboard", you ensure the application logic is actually rendering correctly. Effective website uptime monitoring software uses these content checks to prevent "green dashboard" lies where the system is reachable but unusable.
Monitoring the full stack means tracking every dependency that keeps your service online. A robust strategy includes:
- HTTP/HTTPS: Basic availability and response time verification.
- Keyword Matching: Content validation to ensure the DOM renders correctly.
- API Monitoring: Functional verification of microservices and data endpoints.
- SSL Health: Proactive tracking of certificate validity and security.
- Heartbeat/Cron: Monitoring background tasks and scheduled database syncs.
API and Synthetic Transaction Monitoring
Reliability isn't just about the homepage. It's about the entire sequence of events, from authentication to data retrieval. Synthetic monitoring moves beyond simple GET requests to verify complex API sequences. For instance, a check might authenticate a user, fetch a profile, and update a record in a single pass. For a deeper look at these implementations, read our guide on synthetic API monitoring.
SSL and Domain Health Tracking
An expired SSL certificate is a catastrophic failure that blocks all incoming traffic. Automated SSL monitoring tracks the validity of your certificates and alerts you well before they expire. This prevents the "Connection Not Private" warning that destroys user trust. Domain health tracking works similarly by monitoring WHOIS records to alert you of upcoming expiration dates. At StatusPulse, we integrate SSL health and domain tracking directly into your overall uptime score for a unified view of system health.
Cron job monitoring is the final piece of the puzzle. If a scheduled backup or a data sync fails to send a "heartbeat" within the expected window, you get alerted immediately. This ensures that your background services are as reliable as your public-facing endpoints.
Evaluating Monitoring Software: Data Sovereignty and Pricing Ethics
Choosing website uptime monitoring software is an ethical decision as much as a technical one. Many industry incumbents hide "success taxes" behind complex licensing models. We believe in a different approach. Integrity in monitoring means providing clear costs and respecting where your data lives. It's about moving away from corporate bloat toward tools built for specialists.
The "human agency" factor is often overlooked in modern observability. Some platforms attempt to automate every incident update without oversight. This is risky. A better model uses technology as an assistant. AI should draft your incident reports and summarize logs, but a human should always take the final action. This ensures that your public communication remains truthful and contextually accurate during a crisis.
The EU vs. US Hosting Trade-off
Data residency is a hard requirement for SRE teams in regulated industries. In 2026, GDPR compliance requires data minimization by default. Scripts and plugins that process personal data must be handled with precision. Hosting your monitoring data in the EU ensures you meet these standards without legal grey areas. It simplifies your Data Protection Impact Assessments (DPIAs) by keeping data within a known jurisdiction.
Latency also plays a role in your hosting choice. Monitoring nodes should be close to your primary user base to provide the most accurate performance metrics. If your users are in Berlin, an EU-hosted monitor provides a more realistic view of their experience than a US-based one. StatusPulse provides a choice between EU and US hosting regions to support your specific data sovereignty and latency requirements.
Transparent Pricing vs. Corporate Surprises
Per-subscriber fees on status pages penalize your business for growing. If you gain 5,000 new customers, your monitoring bill shouldn't spike. This "per-seat" or "per-subscriber" model is a relic of legacy enterprise software. It creates unpredictable costs that frustrate DevOps teams and CTOs alike. The ethical argument for flat-rate monitoring is simple: your tools should support your growth, not tax it.
- Flat Pricing: Predictable monthly costs regardless of subscriber count.
- No Hidden Overages: Clear limits on synthetic checks and SMS alerts.
- Feature Parity: Essential security features like RBAC shouldn't be locked behind "Enterprise" paywalls.
Audit your current vendor for hidden "overage" charges. Many providers offer a low entry price but charge heavily for "extra" API checks or status page subscribers. This lack of transparency makes long-term budgeting impossible. By choosing a partner with a flat-rate model, you eliminate the stress of sudden pricing spikes and keep your focus on system reliability.
Case Study: Implementing a Zero-Blind-Spot Strategy
Consider the case of SaaS-X, a hypothetical platform that struggled with a consistent 99.5% uptime rate. While 99.5% sounds acceptable to non-technical stakeholders, it translates to over 3.6 hours of downtime every month. The team faced a recurring problem: their legacy website uptime monitoring software reported everything was green, yet users couldn't process payments. These silent API failures occurred because their previous tool only checked the homepage status code rather than functional endpoints.
The manual overhead of managing these incidents was high. During an outage, developers spent more time drafting status emails and responding to support tickets than actually debugging the root cause. SaaS-X needed to move from a reactive, fragmented approach to a unified strategy that prioritized both technical precision and communication integrity.
Phase 1: Detection and Alert Calibration
The first step involved narrowing the detection window. SaaS-X replaced their 5-minute polling with 1-minute checks across five global regions. This multi-region approach allowed them to filter out localized network blips that often triggered false positives. By requiring at least two regions to confirm a failure before firing an alert, they significantly reduced "alert fatigue" for their on-call engineers.
They integrated these high-frequency alerts directly into their Slack channels and CI/CD pipelines via webhooks. This ensured that the moment an API endpoint returned an unexpected payload, the right team was notified with a specific trace ID. For teams looking to replicate this setup, we've compiled a list of website availability monitoring checklists to streamline the configuration process.
Phase 2: Communicating with Integrity
SaaS-X transitioned from manual incident emails to an automated public status page. Instead of writing updates from scratch while under pressure, they utilized AI incident management to draft technical summaries based on the monitoring data. A human engineer reviewed and published these drafts, maintaining agency while gaining speed. This transparency transformed the user experience.
The impact on support volume was immediate. By providing a "single source of truth" via their status page, SaaS-X saw a 60% reduction in duplicate support tickets during outages. Even when the system was technically down, the proactive communication created a sense of "99.99% perceived uptime." Users stayed informed, churn decreased, and the engineering team could focus entirely on remediation. You can implement your own zero-blind-spot strategy by unifying your monitoring and communication tools into a single, ethical platform.
StatusPulse: Integrated Monitoring and AI-Driven Incident Response
Fragmentation is the enemy of reliability. StatusPulse solves the observability silos discussed earlier by combining uptime, API, and SSL monitoring with native status pages. This unified approach ensures that when a check fails, the communication workflow begins immediately. It's a technical alternative for teams that value precision over corporate bloat. By housing all monitoring data in one place, you reduce the time spent correlating metrics during a crisis.
Our AI incident management doesn't replace the engineer. It acts as an assistant by drafting technical updates based on the telemetry data from your failed checks. This reduces the manual overhead during a high-stress outage, allowing you to maintain transparency without sacrificing time spent on the actual fix. You maintain human agency by reviewing and publishing the final message, ensuring your public status remains accurate and grounded in reality.
Technical Differentiators for DevOps Teams
We prioritize interoperability and modern standards. StatusPulse offers native support for Opentelemetry, ensuring your monitoring data fits into your existing observability stack. Unlike other website uptime monitoring software that charges based on your customer count, we offer flat-rate pricing. This includes unlimited status page subscribers. It's a predictable model designed to support your growth rather than taxing it.
- Unified Dashboard: View HTTP, API, and SSL health in a single pane.
- Unlimited Subscribers: No "success tax" as your user base grows.
- Opentelemetry Support: Integration with modern distributed tracing standards.
- 1-Minute Intervals: High-frequency checks across global regions.
Technical documentation and setup guides are available on the StatusPulse homepage. We've designed the platform to be straightforward, allowing you to configure complex API sequences and heartbeat monitors without unnecessary complexity.
The Ethical Edge in Monitoring
We believe that data sovereignty is a right, not a premium feature. You can choose between EU or US hosting for your monitoring data, ensuring compliance with local regulations like GDPR. We're a team of specialists building for specialists. We don't believe in sales-heavy "demo" requirements or aggressive follow-up calls. You can start a trial, verify the technical depth for yourself, and decide if it's the right fit for your stack.
Integrity is at the core of our cost structure. There are no hidden "enterprise" tiers for essential security features like role-based access control. We provide a fair, transparent alternative to industry incumbents. If you're tired of complex pricing models and corporate bloat, StatusPulse offers a grounded path to reliable monitoring and transparent communication.
Building a Resilient Monitoring Strategy
Reliability in 2026 is about more than avoiding 404 errors. It requires a unified approach that combines high-frequency synthetic checks with honest, transparent communication. By moving beyond basic pings and implementing deep API and SSL verification, you eliminate the silent failures that erode user trust. You also protect your team from the stress of manual incident updates and the financial unpredictability of per-seat licensing models.
Choosing the right website uptime monitoring software is a commitment to your users and your data standards. Whether you require EU-based hosting for GDPR compliance or US-based nodes for regional performance, your tools should support your specific regulatory needs without hidden costs or per-subscriber fees. It's about having a system that assists your team during a crisis rather than adding to the noise. Integrity in monitoring means providing a clear, truthful view of your system health at all times.
Start monitoring your stack with StatusPulse to access flat-rate pricing, integrated AI incident management, and a choice of data hosting regions. Taking control of your observability stack today ensures you're prepared for the incidents of tomorrow.
Frequently Asked Questions
What is the ideal check interval for website uptime monitoring software?
One-minute check intervals are the standard for production environments in 2026. This frequency ensures that you detect intermittent blips and minimize the window of undetected downtime. Slower intervals, such as five or ten minutes, leave significant gaps where issues can persist without triggering alerts, making it impossible to maintain high-availability targets like 99.99% uptime.
How does multi-location monitoring prevent false positives?
Multi-location monitoring requires multiple global nodes to confirm an outage before an alert is triggered. This mechanism prevents false alarms caused by localized network congestion or a specific node's ISP issues. If only one region reports a failure while others see the site as operational, the system identifies it as a local blip rather than a true service outage.
Can I monitor private APIs or internal services with StatusPulse?
Yes, you can monitor internal services using heartbeat or "push" monitoring. Instead of our probes pinging your endpoint, your internal service sends a periodic signal to our platform. If the signal isn't received within the expected window, an incident is triggered. This approach avoids the security risks of opening firewall ports for external probes.
Why should I choose EU-based hosting for my monitoring data?
EU-based hosting is a technical requirement for teams prioritizing data sovereignty and GDPR compliance. It ensures your monitoring data, which may include IP addresses or metadata, stays within a jurisdiction with strict privacy protections. This simplifies legal audits and Data Protection Impact Assessments (DPIAs) for companies operating in or serving the European market.
Does StatusPulse offer automated SSL certificate expiration alerts?
Yes, the platform provides automated tracking for SSL certificate validity and health. It monitors the expiration date of your certificates and sends alerts at predefined intervals, such as 30, 14, and 7 days before they expire. This proactive detection prevents preventable failures like "Connection Not Private" errors that immediately halt all incoming user traffic.
What is the difference between uptime monitoring and synthetic transaction monitoring?
Uptime monitoring verifies basic availability, while synthetic transaction monitoring simulates specific user paths and functional logic. A simple uptime check might confirm a server returns a 200 OK status. Synthetic checks go further, ensuring the login button works or a database returns the correct query result. This depth is essential for website uptime monitoring software to detect silent failures.
How does the AI incident management feature work?
The AI incident management feature drafts technical updates by analyzing telemetry data from your failed monitoring checks. It acts as an assistant by summarizing logs and suggesting status page language, but it requires a final human action to publish. This ensures your communication is fast during a crisis while remaining contextually accurate and under your team's control.
Is there a limit on the number of subscribers for my public status page?
No, there are no limits on the number of subscribers for your public status pages. Our flat-rate pricing model eliminates per-subscriber fees to ensure your costs remain predictable as your user base grows. You can scale your communication to thousands of customers without worrying about sudden pricing spikes or "success taxes" common with legacy enterprise vendors.