

Your status page is green and your logs show 200 OK responses, but your core business logic is failing silently. It's a frustrating reality for SREs and DevOps teams. Standard uptime checks often miss the nuanced regressions that occur when a downstream dependency changes its schema or an AI agent triggers an edge case your tests didn't anticipate. You shouldn't have to wait for a customer support ticket to realize your API is returning empty arrays instead of data.
This guide explains how to implement synthetic API monitoring to catch these failures before they impact your users. We will explore how to move beyond simple pings toward a proactive observability strategy that prioritizes AI-driven incident context and strict data sovereignty. You'll learn to build resilient multi-step assertions and reduce your MTTR without the bloat or complexity of traditional enterprise monitoring tools.
Key Takeaways
- Identify why standard uptime checks fail to catch logic errors that return successful status codes.
- Learn to implement synthetic API monitoring using multi-step assertions to verify complex user journeys like authentication and checkout.
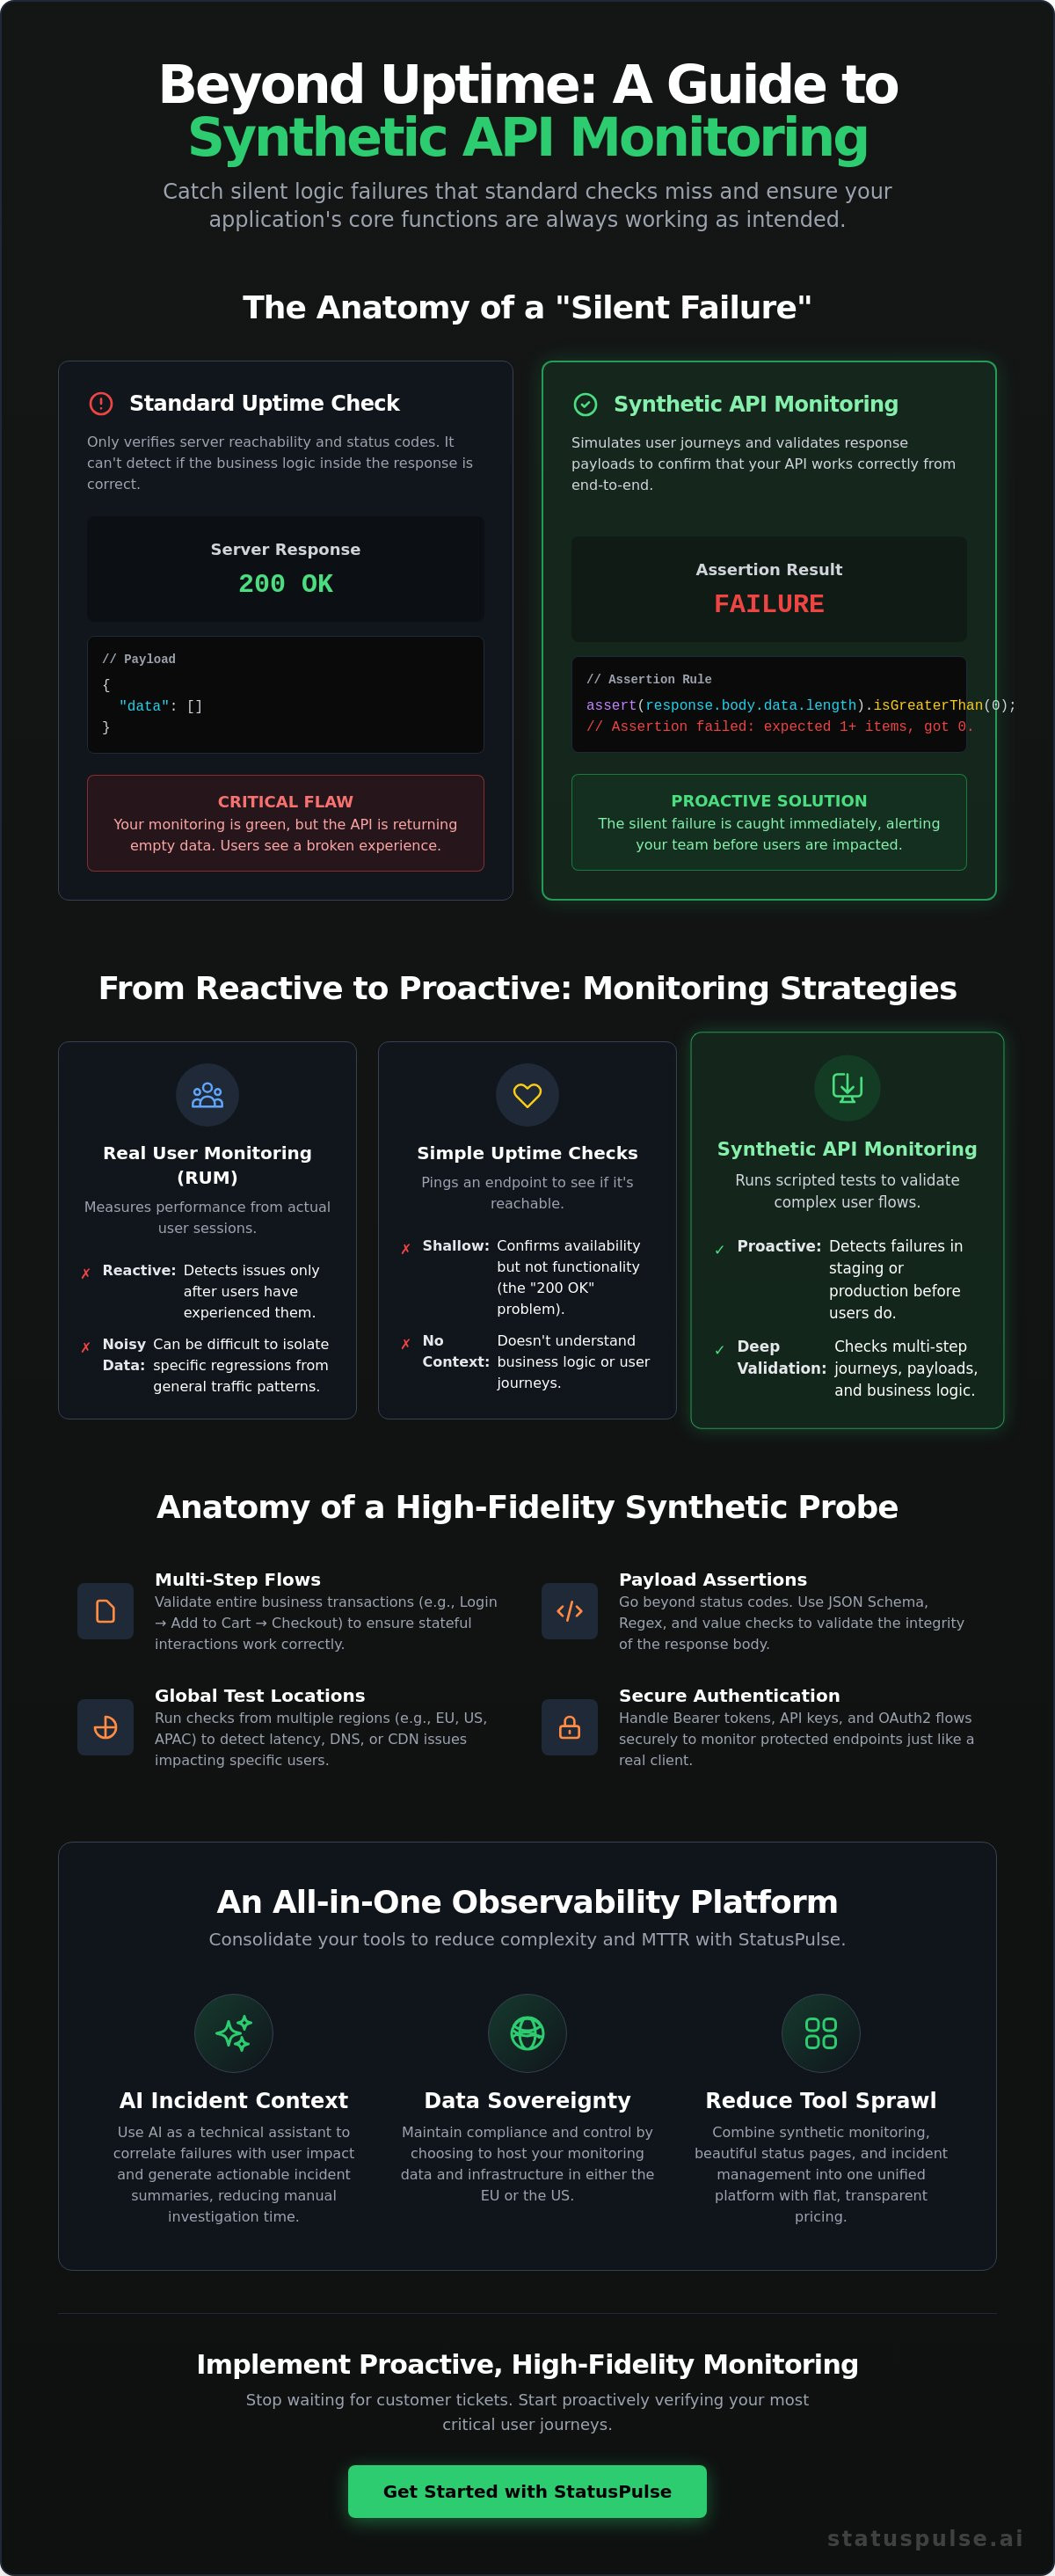
- Use AI as a technical assistant to generate incident context and correlate failures with actual user impact.
- Maintain compliance by choosing between EU and US hosting regions for your monitoring infrastructure.
- Reduce MTTR and tool sprawl by consolidating monitoring, status pages, and incident management into a single platform.
Beyond Uptime: Why Synthetic API Monitoring is Critical for Distributed Systems
Modern distributed systems are too complex for simple ping tests. A server might be reachable, but the application logic behind the endpoint could be broken. Synthetic monitoring solves this by using scripted probes to simulate specific user behaviors. Instead of waiting for a real user to encounter an error, these probes verify that your API responds correctly under predefined conditions. It's a shift from reactive observation to proactive verification.
The "Silent Failure" is a common industry pain point. Your monitoring dashboard shows a sea of green because the load balancer is returning a 200 OK status code. However, the response body might contain an empty object or an error message wrapped in a successful HTTP wrapper. Synthetic API monitoring identifies these discrepancies by inspecting the payload, not just the header. It ensures that the data returned is actually what your frontend or mobile app expects to process.
Real User Monitoring (RUM) is valuable for understanding actual traffic patterns, but it has a major flaw: it's reactive. If an endpoint is failing, RUM only tells you after your customers have already suffered. Synthetic checks provide a clean baseline. They run consistently, regardless of traffic volume. This allows you to detect regressions in staging or low-traffic production environments before the first user hits the broken code. In a microservices mesh, these probes isolate variables, helping you determine if a failure is due to your code, a third-party dependency, or regional network infrastructure.
The Limitations of Passive Monitoring
Passive monitoring relies on volume to be effective. If your "reset password" endpoint fails at 3:00 AM, a RUM-based alert might not trigger until the morning rush. That's hours of downtime for a critical business path. Synthetic probes act as your first line of defense. They provide a steady heartbeat of data. This makes it easy to spot performance degradation or regional latency before it escalates into a full outage. You don't need user traffic to know your system is healthy.
Declarative vs. Imperative Probes
Effective monitoring requires a declarative approach. You define the "desired state" of your API. This includes specific headers, JSON schema validation, and response time thresholds. Modern tools allow you to move beyond imperative "is it up?" checks. You should verify payload integrity across multiple geographic regions. This ensures that a localized DNS issue or a regional CDN failure doesn't go unnoticed.
Assertions are the core of a declarative probe. You aren't just asking if the service is running; you're confirming it works as intended. This might mean checking that a specific UUID is returned or that a price calculation is accurate. Testing from diverse locations like Frankfurt, New York, or Singapore is mandatory. It reveals regional peering issues that a single-region check would miss. At StatusPulse, we focus on making these multi-step assertions straightforward to configure, ensuring your monitoring reflects actual user success criteria rather than just server availability.
The Mechanics of Synthetic API Probes: Assertions, Latency, and Multi-Step Flows
A synthetic probe is essentially a headless client. To build one effectively, you must define the exact HTTP method, headers (like User-Agent or Authorization), and the request payload. Authentication is often the first hurdle. Whether you use Bearer tokens, API keys, or OAuth2 flows, your synthetic API monitoring must handle these credentials securely. It should mimic a real client environment to ensure the results are representative of actual traffic.
Isolated endpoint checks are a start, but they don't reflect reality. A "Login -> Add to Cart -> Checkout" sequence verifies the stateful nature of your application. If the login succeeds but the session token fails to authorize the cart addition, your uptime monitor might stay green while your revenue drops to zero. This is how you Improve User Experience Using Synthetic Monitoring by validating the entire business transaction. These multi-step flows ensure that the handoff between microservices remains intact.
Validating Complex Payloads
Status codes are shallow metrics. Meaningful assertions require deep inspection. Use JSON schema validation to ensure the structure of the response remains consistent. If a key changes from an integer to a string, your frontend might crash. Regex matching is useful for verifying dynamic strings or specific error messages. In distributed systems, data consistency matters. A probe hitting a stale database node might return the correct structure but incorrect data. Your assertions should catch these logical drifts by verifying specific key-value pairs.
Global Latency and Network Path Analysis
A "slow" API is often as damaging as a "down" API. You need to set latency thresholds that distinguish between acceptable performance and degradation. Regional monitoring is mandatory for global SaaS platforms. An API might be fast in London but unusable in Tokyo due to ISP-specific routing issues or regional CDN lag. This isn't always a code problem; it's often a network path problem.
By probing from multiple regions, you gather the raw data needed to set realistic Service Level Indicators (SLIs) and Objectives (SLOs). This regional granularity helps you identify if a performance dip is a global infrastructure problem or a localized network path failure. For teams that value precision without the complexity of legacy enterprise tools, configuring multi-region API monitoring provides the necessary visibility without the overhead. You get the technical depth required to debug global issues without paying an enterprise "tax" for basic regional coverage.
AI Observability: Moving from Raw Data to Actionable Incident Context
Data volume is no longer the primary bottleneck in observability. By 2026, the challenge for SREs has shifted from collecting metrics to interpreting them under pressure. Raw telemetry from synthetic API monitoring can be overwhelming during a cascading failure. AI now serves as a technical assistant that filters this noise, providing immediate context rather than just another notification. It's about moving from "what is happening" to "why does this matter to the user."
Automated impact analysis is the core of this evolution. When a probe fails, an AI assistant can instantly correlate the failure with historical patterns and dependency maps. It identifies if a 403 Forbidden error is a localized permission drift or a global authentication outage. This context reduces alert fatigue by suppressing non-critical "flapping" monitors that don't represent a true service breach. Using synthetic monitoring data as a baseline, these tools help teams prioritize fixes based on actual business risk.
AI-Powered Incident Summarization
Communicating during an outage is stressful. StatusPulse uses AI to bridge the gap between technical failure and stakeholder communication. When a monitor triggers, the system drafts an initial incident update based on the specific error logs and latency spikes observed. AI observability functions as the bridge between raw telemetry and human understanding. We don't believe in "autopilot" for communication. The AI provides a technical draft, but a human specialist always makes the final call before publishing. This ensures honesty and technical accuracy in every update.
Predictive Latency Modeling
Historical data is often an untapped resource. Modern observability platforms use this data to predict seasonal performance degradation. If your API typically slows down by 15% during month-end processing, your thresholds should adapt to prevent false positives. Identifying "flapping" monitors early prevents them from triggering complex incident workflows unnecessarily.
Integrating these AI-generated summaries into public status pages builds trust through transparency. Instead of vague "investigating" messages, you can provide clear, data-backed explanations of the issue. This approach respects the user's time and intelligence. It moves your team away from reactive firefighting and toward a disciplined, proactive observability culture where every alert carries actionable meaning.
Implementation Framework: Deploying Synthetic Checks Across the SDLC
Deployment is only the beginning. A robust framework ensures that your monitors aren't just running in the background, but are actively protecting your release cycle. Implementing synthetic API monitoring requires a disciplined approach that spans from the first line of code to the final production status update. Follow these five steps to build a proactive observability culture.
- Step 1: Identify critical business paths. Don't monitor every endpoint with the same intensity. Focus on high-value paths like user authentication, payment processing, and core data synchronization.
- Step 2: Define assertions for user success. Use the technical assertions discussed earlier to verify more than just status codes. Choose a provider that offers both EU and US hosting to ensure your probes are physically close to your infrastructure and compliant with local data sovereignty laws.
- Step 3: Integrate monitors into CI/CD. Use synthetic checks as automated smoke tests in your pipeline. If a staging API fails its probes, the build should never reach production.
- Step 4: Map monitors to transparency. Link your probes to your public status page. This ensures that technical failures are communicated to stakeholders without manual intervention.
- Step 5: Establish escalation policies. Define exactly who gets paged when a synthetic check fails. Distinguish between a regional latency warning and a global service outage.
Integrating Monitoring into CI/CD
Running synthetic checks against staging environments is a high-leverage strategy. It catches regressions before they impact a single user. You can use webhooks to trigger specific monitors during deployment windows, providing immediate feedback on service health. When choosing a probe architecture, consider the trade-offs. Proprietary agents often offer deeper integration but result in vendor lock-in. OpenTelemetry-based probes are the technical choice for teams prioritizing interoperability and vendor neutrality.
Automating Status Communication
Connecting your uptime monitoring directly to incident alerts removes the "human bottleneck" during an outage. If synthetic checks fail globally, your system should automatically move the status to "Investigating." This immediate transparency builds trust with your users. It also significantly reduces support ticket volume. Users who see a verified incident on your status page are less likely to flood your help desk with duplicate reports.
If you're ready to deploy a framework that respects your time and budget, start your API monitoring with a platform designed for technical precision and honest communication.
StatusPulse: High-Fidelity Monitoring with Transparent, Ethical Pricing
StatusPulse was founded on a simple premise: professional-grade monitoring shouldn't require an enterprise budget or a legal team to decode the invoice. We've seen the "subscriber tax" become an industry standard. This is where incumbents charge you more simply because more of your customers want to stay informed about your system health. We don't do that. Our flat pricing model ensures that your costs remain predictable, regardless of how many people subscribe to your status page updates.
Implementing synthetic API monitoring shouldn't be a financial burden. We provide high-fidelity probes and multi-step assertions without the corporate bloat. By consolidating API monitoring and AI-driven incident management into one platform, we eliminate the friction that usually occurs during an outage. You get the technical depth you need without the unnecessary complexity of a "full-stack" suite that you only use 10% of.
Why Data Sovereignty Matters in 2026
The technical choice of where your data lives is now a legal requirement. For European enterprises, hosting monitoring data in the US can create significant compliance hurdles under GDPR and the Data Privacy Framework. StatusPulse gives you the agency to choose. You can host your monitoring infrastructure in either the EU or the US. This isn't just about reducing latency; it's about principled data handling. We ensure that your probes and logs remain within your preferred jurisdiction, supporting your regional sovereignty and regulatory requirements.
The Value of a Unified Workflow
Context switching kills efficiency. Moving between a monitoring tool, a status page provider, and an incident drafting assistant wastes precious minutes during a critical event. Our unified platform brings these functions together. Our AI assists your team by drafting incident context from your synthetic failures, but you always maintain the final action. It's a human-centric approach to high availability that values precision over automation for automation's sake.
Start small. Automate your critical paths early. Keep your communication honest and your pricing transparent. If you're tired of corporate bloat and hidden fees, explore StatusPulse for a more ethical and technical approach to observability. We believe in building tools that solve problems, not tools that create new billing headaches.
Building a Resilient API Strategy for 2026
Relying on status codes alone is a legacy approach that leaves your system vulnerable to silent logic failures. Effective synthetic API monitoring requires a shift toward multi-step assertions and proactive verification within your CI/CD pipeline. By integrating AI as a technical assistant, you can move beyond raw metrics to actionable incident context that actually helps your team resolve issues faster. This approach ensures that your observability strategy reflects the actual experience of your users.
Implementing these strategies doesn't have to be expensive or complex. You can choose between EU and US hosting to maintain data sovereignty while benefiting from AI-powered incident drafting that keeps your stakeholders informed. We believe in providing these professional-grade tools with transparent, flat pricing and zero per-subscriber fees. Reliability is a continuous practice. It starts with choosing tools that value technical precision over corporate bloat and hidden costs.
Start monitoring your APIs with StatusPulse today and catch failures before your users do. It's time to build a more transparent and reliable bridge between your code and your customers.
Frequently Asked Questions
What is the difference between synthetic and real user monitoring (RUM)?
Synthetic monitoring uses scripted probes to simulate user behavior and provide a consistent performance baseline. It's proactive, allowing you to catch failures before users encounter them. Real User Monitoring (RUM) is reactive, capturing data from actual user sessions to understand real-world experience. While RUM shows you what happened to users, synthetic checks tell you if your system is ready for them.
Can synthetic API monitoring detect performance regressions in CI/CD?
Yes, synthetic API monitoring is a highly effective tool for catching regressions during the development cycle. By running probes against staging or preview environments, you can verify that new code meets your latency and logic assertions before it reaches production. If a probe fails, your CI/CD pipeline can automatically halt the deployment to prevent an outage.
How does AI assist in API incident management?
AI functions as a technical assistant that provides immediate context during an outage. It correlates raw failure data with historical patterns to identify if an issue is a localized drift or a global failure. At StatusPulse, our AI also drafts incident updates for your status page, translating technical logs into clear language for your stakeholders while you focus on the fix.
Is synthetic monitoring compliant with GDPR and data sovereignty laws?
Compliance depends on where your monitoring data is processed and stored. Many enterprise tools default to US-based hosting, which can create legal friction for European companies. StatusPulse supports data sovereignty by allowing you to choose between EU and US hosting. This ensures your synthetic API monitoring data remains within your required jurisdiction to meet GDPR and regional standards.
What are the most important assertions to set for an API monitor?
Beyond checking for a 200 OK status code, you should implement JSON schema validation to ensure response structures haven't changed. Assertions should also include latency thresholds to detect performance degradation. Verifying specific key-value pairs in the response body is critical for catching logic errors where the API remains "up" but returns incorrect or empty data.
How often should synthetic API checks run to ensure high availability?
For critical business paths like authentication or checkout, you should run checks every 1 to 5 minutes. Less critical endpoints might only require probing every 15 to 30 minutes. High-frequency checks provide faster detection but can increase noise; balancing frequency with meaningful assertions is the most effective way to maintain high availability without alert fatigue.
Do I need to install an agent to use StatusPulse API monitoring?
No, StatusPulse is a cloud-native platform that probes your endpoints externally. You don't need to install or maintain any agents on your servers. This headless approach simplifies your infrastructure and ensures that your monitoring results reflect what an actual user or third-party service experiences when calling your API from the public internet.
How does StatusPulse handle multi-step API authentication like OAuth2?
StatusPulse handles complex authentication by allowing you to chain multiple requests within a single monitor. You can configure a probe to first call your identity provider to exchange credentials for a token. That token is then stored as a variable and passed into the headers of subsequent API calls in the sequence, effectively simulating a full stateful session.


