
Most website monitoring tools are better at generating noise than preventing outages. You've likely felt the frustration of a 3 AM alert that turned out to be a transient network blip. Choosing the right website monitoring tool shouldn't mean trade-offs between technical precision and transparent pricing models that penalize you for having a large audience.
We agree that monitoring should reduce stress, not add to it through surprise subscriber fees or manual incident logs. This guide provides a technical framework for evaluating reliability in 2026. You'll learn how to implement 1-minute check intervals and AI-assisted incident drafting while maintaining strict control over EU or US data residency. By the end, you'll have a clear path to achieving high-frequency uptime monitoring without sacrificing your team's focus or your budget's predictability. We'll strip away the industry bloat to focus on the metrics that actually keep your services online.
Key Takeaways
- Transition from basic ICMP pings to synthetic HTTP(S) transactions to verify real-world application availability and performance.
- Evaluate any website monitoring tool based on its ability to deliver 1-minute check intervals from global probes without added complexity.
- Avoid the "per-subscriber" pricing trap in status page software by opting for flat-rate models that support data sovereignty in the EU or US.
- Combat alert fatigue by implementing a technical hierarchy that distinguishes between critical system failures and non-urgent warnings.
- Accelerate incident response times with AI-assisted drafting tools that turn technical telemetry into clear, public-facing status updates.
Beyond the Ping: What Defines a Modern Website Monitoring Tool?
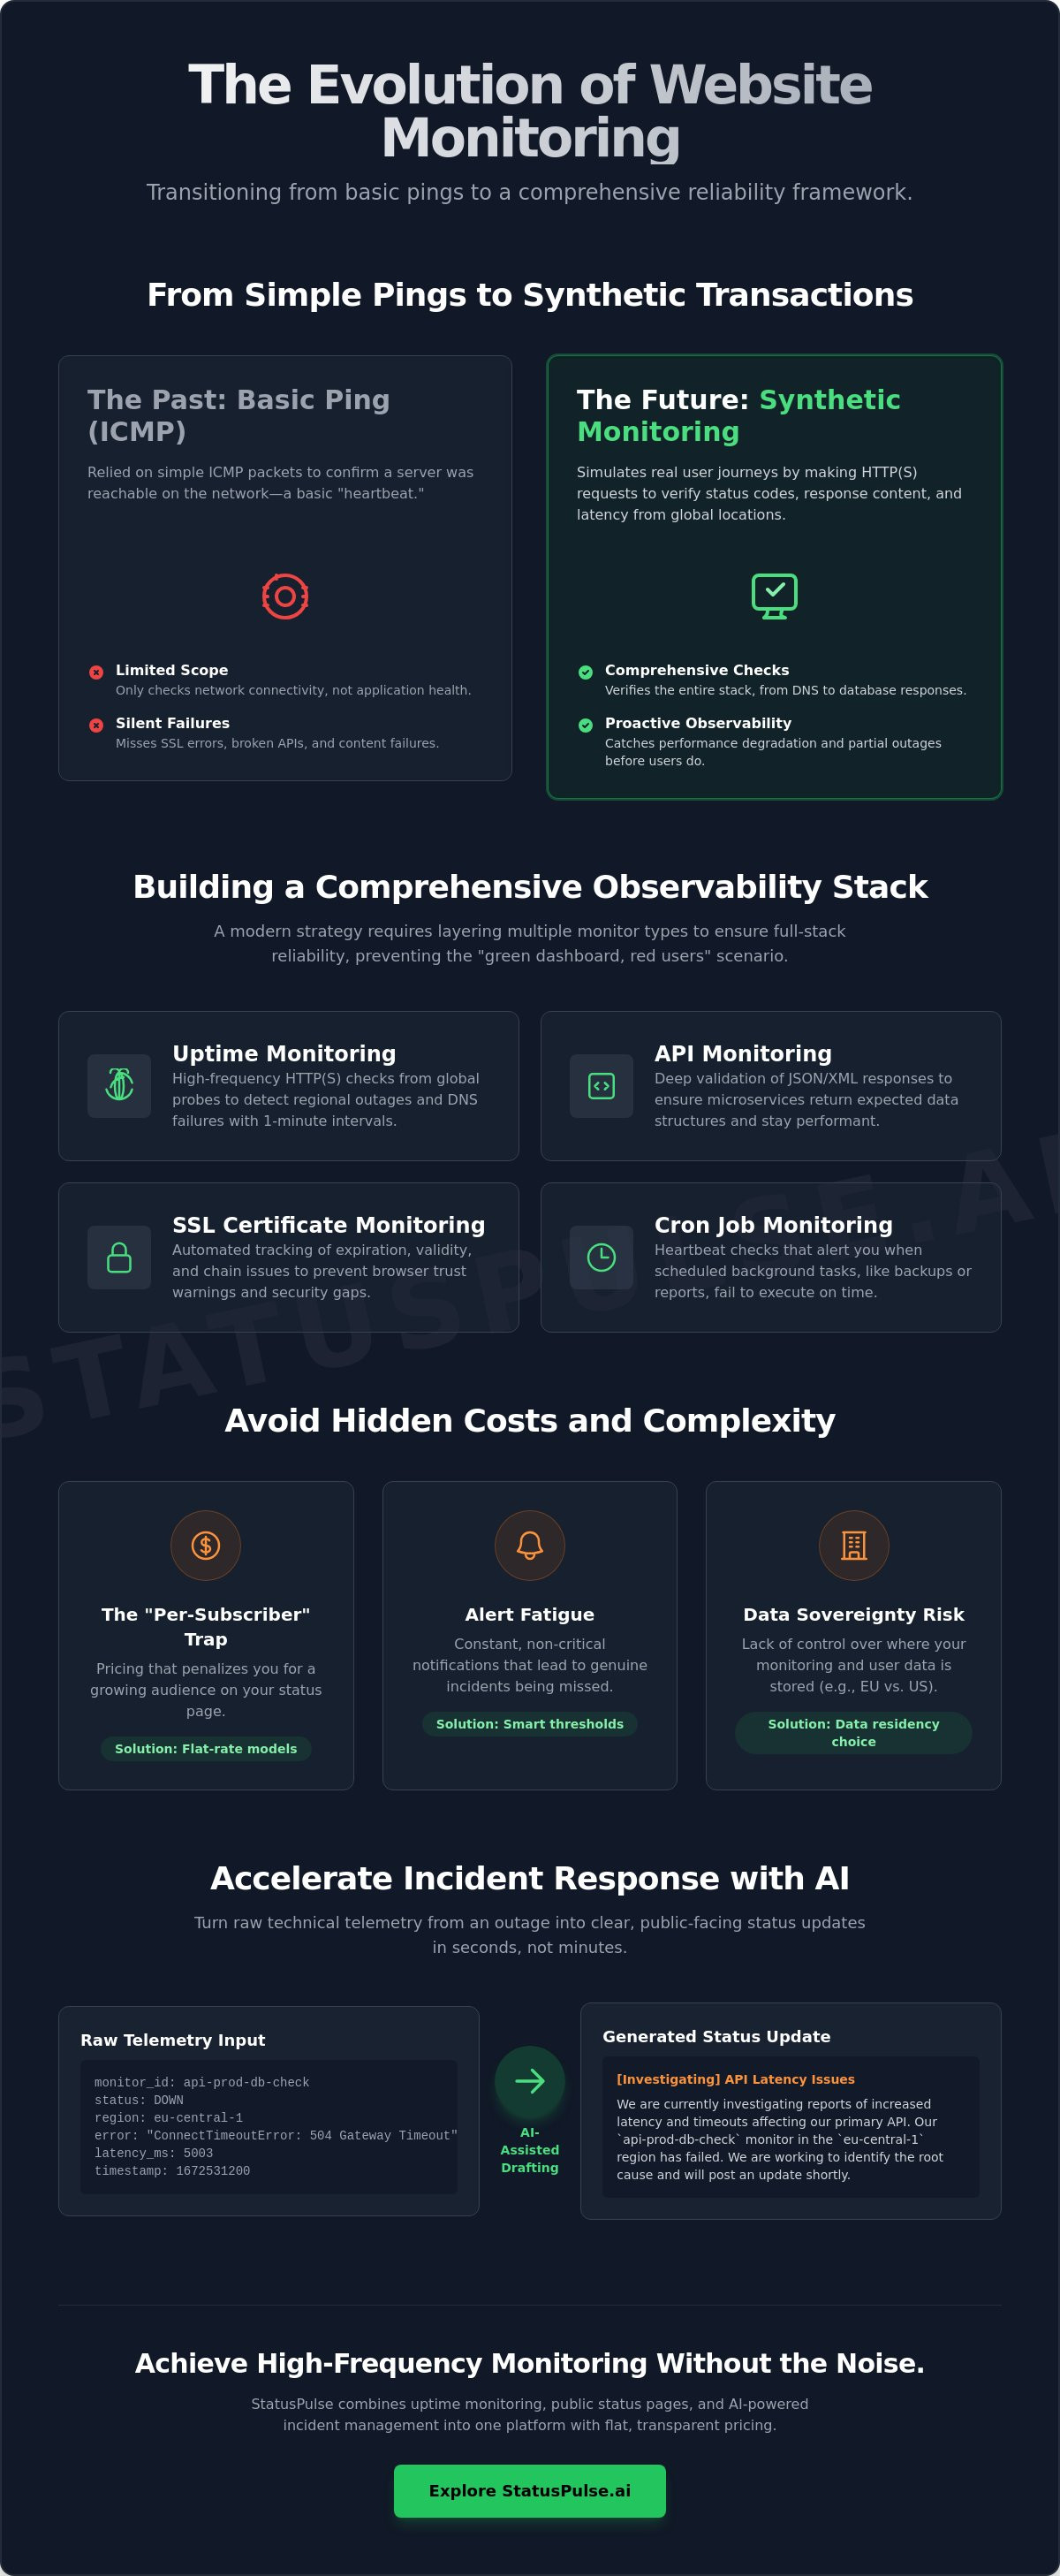
A modern website monitoring strategy involves more than checking if a server responds to a packet. It is the continuous verification of availability, performance, and security. Historically, developers relied on ICMP pings to confirm a simple heartbeat. Today, a robust website monitoring tool must simulate actual user intent through synthetic HTTP(S) transactions. This ensures the entire stack, from DNS resolution to the database query, functions as expected.
Reliability requires a three part framework: monitoring, alerting, and communication. Monitoring identifies the failure. Alerting ensures the right human sees it. Communication manages the fallout through transparency. Without all three, you aren't monitoring; you're just collecting data points. Effective systems verify status codes, headers, and specific strings in the response body. This prevents partial outages where a page loads but the critical content is missing.
| Method | Scope | Key Limitation |
|---|---|---|
| Basic Ping (ICMP) | Network Connectivity | Ignores application logic and SSL health. |
| Synthetic Monitoring | HTTP(S) Transactions | Doesn't capture client side JS execution. |
| Real-Browser Testing | Full DOM/JS Rendering | High resource overhead and slower execution. |
The Shift from Availability to Observability
Modern SaaS doesn't just fail; it degrades. A site that takes 10 seconds to load is effectively down for your users. Proactive observability patterns look at response time percentiles like P95 or P99 rather than simple averages. If your latency spikes, your user retention drops. You need to see the "why" behind the slowdown before the support tickets start piling up. Simple uptime checks are reactive. Observability is proactive.
The Business Impact of Silent Failures
Silent failures are the most dangerous. Your Nginx server might return a 200 OK, but your API could be returning an empty JSON object because a background worker crashed. Or perhaps your SSL certificate expired, locking out every visitor while your uptime check remains green. Transparent communication via an integrated public status page prevents churn during these events. It turns a technical failure into a trust building exercise by showing your team is already on the case.
Key Monitoring Types: Building a Comprehensive Observability Stack
A single uptime check is a baseline, not a strategy. Reliability requires layering different monitor types to catch failures at every level of your stack. A professional website monitoring tool should provide a unified view of your frontend, backend APIs, and background processes. This prevents the "green dashboard, red users" scenario where your server is reachable but your application logic is failing.
- Uptime Monitoring: High-frequency HTTP(S) checks from global locations to detect regional routing issues or DNS failures.
- API Monitoring: Deep validation of JSON responses to ensure your microservices are returning the expected data structures.
- SSL Certificate Monitoring: Automated tracking of validity, revocation, and chain issues before they trigger browser warnings.
- Cron Job Monitoring: Heartbeat checks that alert you when scheduled tasks, like database backups or report generation, fail to run.
Synthetic API Monitoring for Microservices
Checking the root of your API often yields a false sense of security. You must monitor specific endpoints that interact with your database or third party services. When optimizing website performance, identifying slow API responses is just as critical as measuring frontend render times. A standard configuration for a health check endpoint might look like this:
GET /api/v1/health
Host: api.yourdomain.com
Accept: application/json
Expected Response:
Status: 200 OK
Body contains: {"status": "healthy", "db_connected": true}
This approach ensures that your backend dependencies are functional. For a deeper dive into maintaining high availability for your services, consult our API Monitoring: The Developer’s Guide.
SSL and Domain Health Tracking
Manual tracking of SSL certificates is a liability that always fails at scale. Certificates expire, and domain registrations lapse. Automated monitoring serves as your final line of defense against these preventable outages. You should monitor for certificate revocation and ensure your intermediate chain is correctly configured. A broken chain might work in some browsers but fail in others, creating a fragmented experience for your users. Integrating these checks into your uptime monitoring workflow ensures you receive alerts weeks before an expiry date, giving your team ample time to rotate keys without urgency.
The Hidden Cost of Monitoring: Complexity, Pricing, and Data Sovereignty
Engineering teams often discover the true cost of their website monitoring tool during their first major outage. While standard uptime checks might be affordable, the secondary costs for status page subscribers can escalate quickly. Many incumbents use a "per-subscriber" model. This creates a perverse incentive where communicating with more customers during a crisis increases your monthly bill. It is a pricing trap that punishes transparency and complicates budget forecasting for growing companies.
Beyond the invoice, there are significant business and security implications to consider regarding where your data lives. When monitoring logs contain IP addresses or user metadata, the physical location of the server becomes a legal priority. Enterprise bloat often hides these details under layers of complex UI. This hinders engineering velocity by forcing teams to navigate corporate compliance hurdles just to set up a simple heartbeat check. A tool that requires a forty page manual just to configure an API check isn't an asset; it's a bottleneck.
GDPR and Data Residency in Monitoring
EU-based teams face strict requirements for data residency. Using a US-centric provider for European infrastructure often complicates GDPR compliance. If your monitoring data is stored on US servers, you may be subject to different privacy frameworks that don't always align with local regulations. While [VERIFY: GDPR compliance of top 3 competitors] provide varying levels of documentation, the simplest solution is choosing a provider that offers native EU hosting. This choice supports data sovereignty and eliminates the legal ambiguity of cross-border data transfers.
Scalability without Financial Penalties
Scaling your observability stack shouldn't lead to exponential costs. Most providers charge per-monitor or per-feature, which often discourages developers from monitoring smaller microservices or internal tools. Engineering teams shouldn't be penalized for being thorough. At StatusPulse, we prioritize flat, transparent pricing. By removing per-subscriber fees and offering a choice between EU or US hosting, we provide a principled alternative to the bloated pricing models of corporate incumbents. This allows your team to focus on technical precision and uptime rather than constant budget reconciliation.
Avoiding Alert Fatigue: A Technical Framework for Thresholds
Alert fatigue is a systemic risk to engineering teams. When your inbox is flooded with non-actionable notifications, real production incidents get ignored. Research indicates that 36% of IT teams feel buried in alert fatigue, which directly contributes to SRE burnout and increased Mean Time to Recovery (MTTR). A professional website monitoring tool should function as a filter, not a megaphone.
For engineers looking to transition to teams with better observability practices, presenting an optimized technical profile is key. A platform like Rezumi uses AI to help job seekers tailor their resumes for ATS, making it easier to find organizations that prioritize technical precision over constant fire-fighting.
Reliability requires a "Critical vs. Warning" hierarchy. A "Critical" alert represents a complete service outage or a failed primary API endpoint. A "Warning" might signify a latency spike or an SSL certificate expiring in 30 days. Separating these ensures that 3 AM wake-up calls are reserved for actual emergencies. You should also implement multi-location verification. A failure should only trigger an incident if verified by at least two independent global probes to eliminate false positives caused by local network congestion.
Establishing a robust escalation policy is the final step in protecting your team's focus. Use this checklist to audit your current alerting logic:
- Failure Thresholds: Require at least two consecutive failed checks before notifying a human.
- Ownership Mapping: Route alerts directly to the team responsible for that specific microservice.
- Smart Cooldowns: Prevent repeat notifications for the same ongoing issue.
- Maintenance Windows: Automatically silence alerts during scheduled deployments or database migrations.
Configuring Intelligent Check Intervals
High-frequency monitoring is essential for mission-critical paths. 1-minute check intervals provide the resolution needed to catch "flapping" services that 5-minute intervals might miss. While high-frequency synthetic checks add slight overhead, the visibility they provide into P99 latency is worth the trade-off. For static documentation or internal staging environments, 5-minute intervals are usually sufficient to manage resource costs. You can configure a high-priority check using a simple JSON structure:
{
  "name": "Primary Checkout API",
  "url": "https://api.v1.com/checkout",
  "interval": 60,
  "threshold": 2,
  "regions": ["us-east-1", "eu-central-1"]
}
Integrations: Where Alerts Should Live
Email is where alerts go to die. For critical production outages, you need real-time delivery through Slack, Discord, or custom Webhooks. These integrations allow for immediate team discussion and faster coordination. If you rely on email, you're adding minutes of latency to your response time. For more on optimizing your response stack, see our Website Uptime Monitoring Tools: A Developer’s Guide. To start building a quieter, more effective alerting system, you can reduce alert noise with StatusPulse today.
StatusPulse: Merging Uptime Monitoring with AI-Powered Incident Communication
Monitoring is only half of the reliability equation. The other half is how you communicate when things go wrong. Most developers use one website monitoring tool for uptime and a completely separate service for their status page. This fragmentation creates friction during high pressure incidents. StatusPulse solves this by unifying uptime monitoring, API verification, and SSL tracking with a native, AI-assisted communication layer.
We built this platform to eliminate the corporate bloat that slows down engineering teams. You shouldn't have to navigate complex enterprise dashboards just to see if your backend is healthy. By integrating AI into the incident workflow, we help you bridge the gap between technical telemetry and human understanding. Whether you require EU or US hosting for data sovereignty, your monitoring stack remains compliant and focused on precision.
Automating Transparency with AI
During an active outage, your primary focus is on the fix, not the status update. StatusPulse uses AI to analyze technical telemetry and draft incident summaries for your stakeholders. These drafts translate complex error codes into clear language that explains the impact to non-technical users. We utilize a human-in-the-loop approach; the AI acts as an assistant that prepares the text, but you maintain final control over what gets published. This automation significantly reduces support ticket volume by keeping customers informed in real-time without pulling you away from your terminal.
Deployment and Setup in Under 5 Minutes
Getting started doesn't require a sales call or a lengthy onboarding process. You can deploy a new monitor and a public status page in three steps: enter your URL, select your global probe locations, and choose your hosting region. We provide 1-minute check intervals and deep API monitoring as standard features. Our pricing model is intentionally flat. We don't believe in charging per-subscriber fees for your status page. Your cost remains predictable regardless of how many customers sign up for updates. This ethical approach to pricing ensures that your budget scales with your infrastructure, not your audience size.
Reliability in 2026 requires a tool that respects your time and your data. You can build your public status page with StatusPulse today and start monitoring your services with a platform designed by specialists for specialists.
Modernizing Your Reliability Stack
Reliability in 2026 requires more than just a green light on a dashboard. It demands a website monitoring tool that integrates deep synthetic checks with transparent communication. You've seen how layering API validation, SSL tracking, and smart alert thresholds can protect your team from burnout. By choosing a platform that respects data sovereignty and avoids predatory pricing models, you prioritize both technical precision and ethical operations.
Your monitoring should be an assistant, not a source of stress. StatusPulse provides a unified environment for uptime, AI-powered incident management, and public status pages. With the choice between EU or US hosting and flat pricing that never charges for subscribers, you can scale your infrastructure with confidence. It's time to move beyond the ping and build a system that works for your engineers and your users.
Ready to simplify your observability? Start monitoring your stack with StatusPulse and gain the clarity your services deserve.
Frequently Asked Questions
What is the difference between uptime monitoring and website performance monitoring?
Uptime monitoring is a binary check that verifies if a service is reachable and returning a valid status code. Performance monitoring is a gradient check that measures the quality of that connection through metrics like Time to First Byte (TTFB). While uptime prevents total outages, performance monitoring identifies speed degradation that could cause user churn long before a total system failure occurs.
How many monitoring locations are necessary for a global SaaS application?
A global SaaS application typically requires 3 to 5 monitoring locations to account for regional routing issues. Probes in North America, Europe, and Asia-Pacific ensure you detect localized outages that might be invisible from a single region. This distributed approach helps verify that CDN nodes and regional load balancers are functioning correctly for your entire user base across different continents.
Can a website monitoring tool detect SSL certificate errors before they expire?
A professional website monitoring tool tracks the expiration date of your SSL certificates and sends alerts weeks in advance. It also verifies the certificate chain and revocation status to prevent browser security warnings. Automated tracking eliminates the risk of manual oversight; which is a common cause of preventable site downtime in complex production environments with multiple subdomains.
What are the benefits of using a public status page during an incident?
Public status pages centralize incident communication and reduce the volume of duplicate support tickets during an outage. They provide a single source of truth for stakeholders and customers, building trust through transparency. By offloading communication to a dedicated page, your engineering team can focus entirely on technical remediation rather than answering repetitive status queries from concerned users.
How does multi-location verification reduce false positive alerts?
Multi-location verification requires at least two independent probes to confirm a failure before an alert is triggered. This prevents notifications caused by transient network congestion or local ISP issues at a single monitoring node. By requiring consensus among global probes, you ensure that alerts represent actual service disruptions rather than localized network noise that doesn't impact your broader audience.
Is EU-based hosting required for GDPR compliance in website monitoring?
GDPR doesn't strictly mandate EU-based hosting, but it requires rigorous standards for data protection and international transfers. Choosing a website monitoring tool with native EU hosting simplifies your compliance posture by keeping logs within the same legal jurisdiction. This supports data sovereignty and eliminates the legal ambiguity often associated with US-centric providers managing European infrastructure data and user metadata.
How does AI incident management help DevOps teams during an outage?
AI incident management assists DevOps teams by summarizing complex telemetry and log data into clear, human-readable incident drafts. It identifies the scope of an outage and proposes status updates for non-technical stakeholders. This "assistant" model allows engineers to maintain technical control while accelerating the communication workflow during high-pressure production events, ensuring that customers stay informed without slowing down the fix.
What is the ideal check interval for a production-grade website?
The ideal check interval for production-grade websites is 60 seconds. This high-frequency polling ensures you catch intermittent failures and minimizes the time between a service drop and a team notification. For internal staging environments or static documentation sites, a 5-minute interval is often sufficient to balance monitoring visibility with resource overhead, as these systems aren't usually mission-critical.


