

What if your uptime check stays green while users can’t sign in or complete a request? Uptime monitoring for web applications needs to test more than whether a server responds. A successful ping or HTTP 200 can still hide a broken user journey.
Choose checks that reflect important application functions, set alerts your team can act on, and plan how detection leads to a response. This guide covers check types, monitoring locations, rollout, and platform selection so your team can distinguish a reachable service from one users can actually rely on.
Key Takeaways
- Choose checks that test meaningful application behavior, not just whether a server responds.
- Use HTTP(S), response validation, API, and SSL checks to cover different failure modes, and understand what each one can miss.
- Set check frequency, monitoring locations, and alert conditions around service impact and your team’s response needs.
- Roll out uptime monitoring for web applications by defining critical paths, testing healthy and failure conditions, and assigning alert owners.
- Compare monitoring coverage, status-page needs, incident workflows, hosting requirements, and pricing structure when choosing a platform.
What Uptime Monitoring for Web Applications Actually Tells You
Your server returns an HTTP 200, but customers can’t complete checkout because the payment service is failing. The server is reachable; the application’s critical function is not. That distinction is central to uptime monitoring for web applications: repeated checks test whether a service meets a defined availability condition, but the result only tells you what the check is designed to verify.
Infrastructure reachability means a system can be contacted; application availability means users can perform the actions the service promises. A passing check is useful evidence, not proof that every feature, user journey, or dependency works.
Availability, uptime, and application health are not identical
Uptime describes availability over a period of time. It can help teams understand how often a monitored service met its availability condition, but it doesn’t provide a complete assessment of user experience. A reachable host can still serve a broken login page, reject valid credentials, or fail during checkout.
Application health depends on which actions matter to users and whether the components those actions rely on work together. Set availability targets according to the service’s purpose, user expectations, and operational needs. There is no single target that fits every application.
What an external check can and cannot observe
An external check runs from a monitoring service and tests a configured endpoint, such as a webpage or API. Depending on its configuration, it may confirm that a response arrives, check its status, or look for expected content. The result reflects that endpoint, location, timing, and the specific conditions of the check.
It won’t automatically reveal every internal cause. A failed response could stem from an application error, a dependency, a network path, or another issue. The check helps identify a symptom; logs, traces, and metrics may be needed to diagnose the underlying fault. The broader concept of website monitoring includes checks of availability, performance, and functionality, each observing a different part of service behavior.
Use external checks to answer a focused question: “Can this location reach this endpoint and verify the condition we care about?” For more on defining and measuring availability, see the website availability monitoring guide. Next, match each check type to the failure it can actually detect.
Which Checks Reveal Web Application Failures?
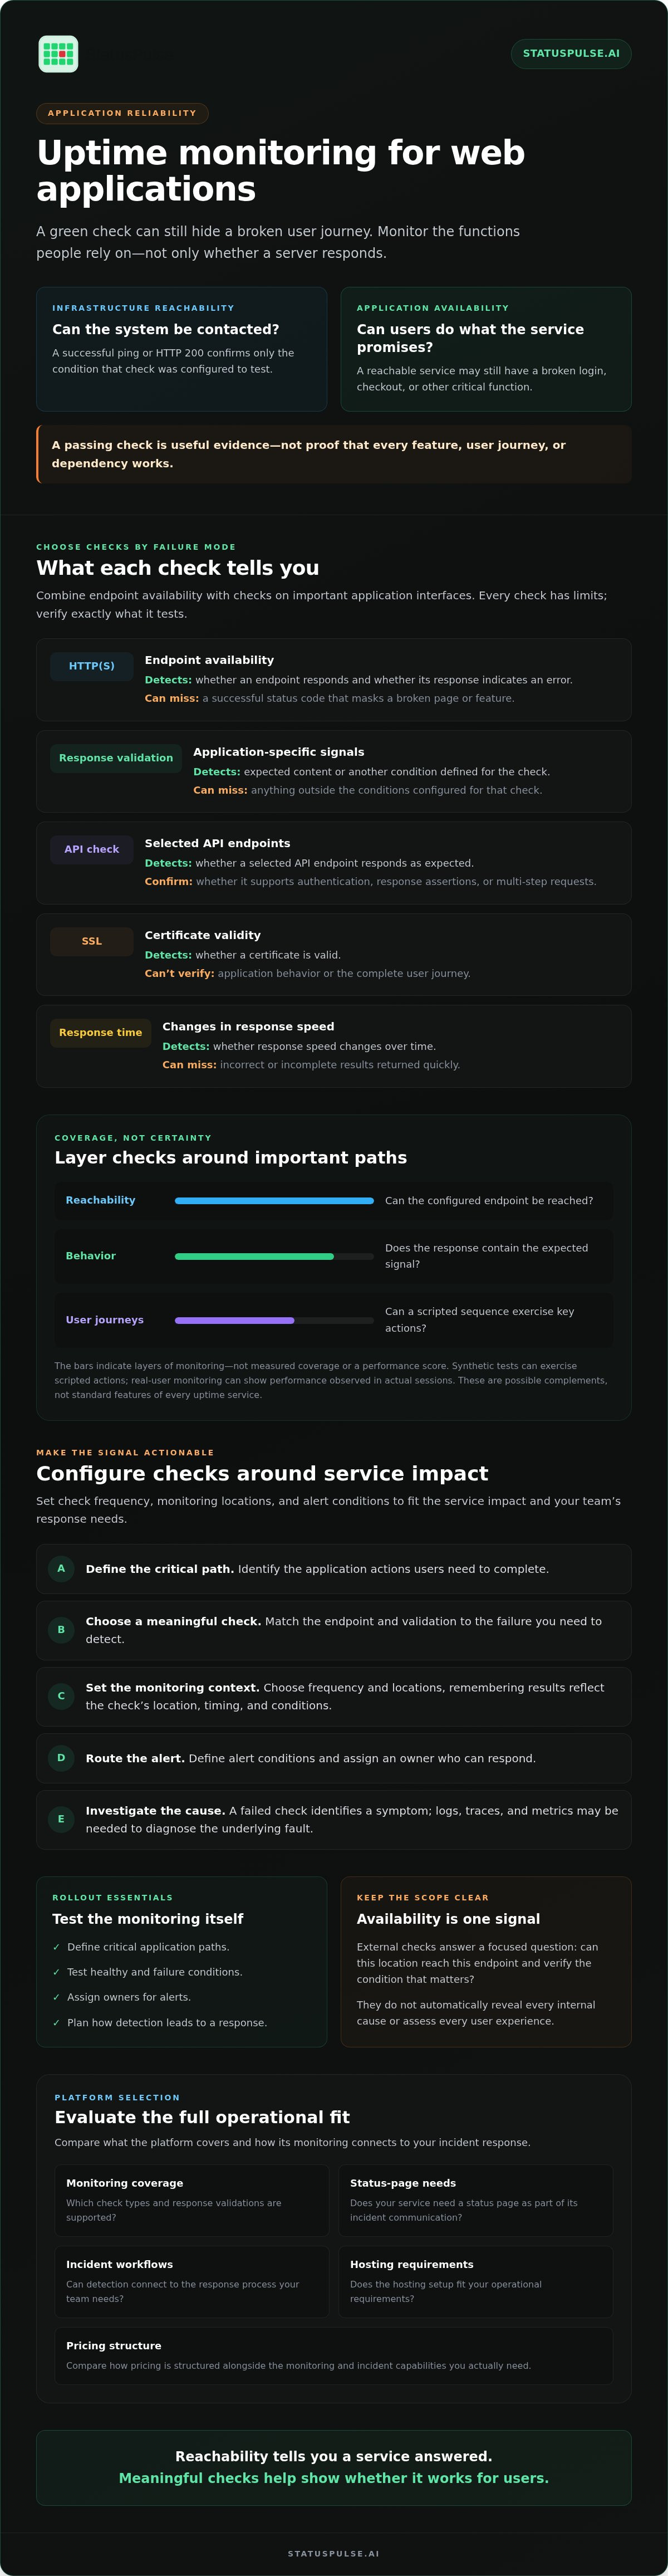
Choose checks based on the failure you need to detect, not the number of check types a tool lists. A useful setup combines endpoint availability with checks on important application interfaces. Each check has limits, so confirm what it tests before relying on its result.
| Check type | What it detects | Main limitation |
|---|---|---|
| HTTP(S) availability | Whether an endpoint responds and whether its response indicates an error | A successful status code doesn’t prove the page or feature works correctly |
| Application-specific response validation | Whether a response includes expected content or another defined signal | Only validates the conditions configured for that check |
| API check | Whether a selected API endpoint responds as expected | Test depth varies; confirm support for authentication, response assertions, or multi-step requests |
| SSL certificate monitoring | Whether a certificate is valid | Doesn’t verify application behavior or the full user journey |
| Response-time monitoring | Whether response speed changes over time | A fast response can still return incorrect or incomplete results |
Match each check to a failure mode
Use HTTP(S) checks for reachability and unexpected responses. Add response validation when a generic success code could hide a problem, such as an application returning an error message with a successful status. API checks can cover service interfaces, but confirm whether the tool checks only reachability or also validates response content and authenticated requests.
SSL certificate monitoring tracks certificate validity, which is separate from whether the application functions. Check which certificate states and notifications a provider supports rather than assuming it will alert under a particular condition.
Layer checks without mistaking coverage for certainty
Pair a basic availability check with checks for high-value endpoints. Synthetic tests can exercise scripted actions, while real-user monitoring can show performance observed in actual sessions. These are possible complements, not standard features of every uptime service. Response time adds context, but speed alone can’t prove that a user journey succeeds.
The NIST Information Security Continuous Monitoring (ISCM) strategy concerns security monitoring, a distinct discipline from service availability checks. Keep those goals separate when choosing coverage. For API-specific selection questions, see the API monitoring guide.
How to Choose Check Frequency, Locations, and Alert Conditions
Set monitoring frequency and locations according to user impact, failure risk, and how quickly your team needs to respond. A high-impact service may justify more frequent checks than a low-risk internal endpoint, but faster checks only help if the team can act on the signal. Treat these settings as operational choices, not universal defaults.
Set check coverage around users and dependencies
Choose locations that reflect where your users and critical dependencies operate. A check from one location shows whether that route can reach the service; it can’t establish availability for users everywhere. Checks from additional regions may reveal regional failures, but differences can also come from routing or monitoring-provider network conditions. Compare results before declaring a broad outage.
Where your tool allows it, monitor your application endpoint separately from a third-party dependency. If a payment provider has an issue while your application remains reachable, separate signals help clarify what users can and can’t do. Don’t label the whole service unavailable based on a dependency check alone unless that dependency blocks a critical function.
Make alerts actionable instead of noisy
Define the expected response for each check: what condition counts as failure, who owns the alert, and what they should verify first. Choose an alert window that fits the service’s impact and your team’s response needs. Requiring a failure to persist across checks can help distinguish a transient error from a sustained issue, but the right threshold depends on how quickly users could be affected.
Performance signals need the same care. Agree on what response-time change warrants investigation, then interpret it alongside availability and application behavior. The Web Performance Working Group develops web performance measurement standards. Those measurements can add context, but they don’t confirm on their own that a critical user action succeeds.
Before treating an alert as an incident, use this quick validation checklist:
- Confirm the signal: Is the expected response condition failing, or did one check time out?
- Compare locations: Do other configured regions report the same problem?
- Check user impact: Is a critical endpoint or action affected?
- Identify ownership: Who investigates, and what is their first step?
Document how the team distinguishes a transient failure from a sustained, user-impacting incident. For broader guidance on connecting monitoring signals to operational response and clear communication, read the developer uptime monitoring guide.
A Practical Rollout: From First Check to Incident Review
Monitoring is only useful if the check tests the right thing, the alert reaches someone who can act, and users receive accurate updates. Roll it out as an operational workflow, then review how it performs during real incidents.
- Identify critical paths. List the user actions whose failure would materially affect service, such as signing in or submitting an order. Choose the endpoints or application conditions that provide a meaningful signal for each path.
- Configure checks. Point each check at the intended production or test environment. Record what response counts as healthy, what the check cannot detect, and any planned maintenance that could affect results.
- Test healthy and failure conditions. Confirm that a known-good response passes and a safe, intentional failure is detected. Verify that the check evaluates the expected response, not merely that it reached an endpoint.
- Test alert delivery and assign owners. Send a test alert through the real notification path. Make clear who investigates, who handles escalation, and what the first diagnostic step should be.
- Review and refine. After an incident or a false alarm, check whether the monitor detected the impact, whether the notification was useful, and whether ownership was clear. Adjust the check or runbook when evidence shows a gap.
Validate monitoring before depending on it
Keep a short runbook with the check’s purpose, expected response, limitations, exclusions, owner, and maintenance notes. Re-test after changes to the endpoint, authentication, or notification path. A monitor can silently become irrelevant if the application changes but its success condition does not.
Turn detection into useful incident communication
Separate confirmed impact from an unverified cause. An initial update can state which service or function is affected and that the team is investigating. Add a cause only after evidence supports it. A public status page gives users a place to see the verified service state and subsequent updates.
AI-assisted incident tools may help draft updates or summarize impact, but a person should review and approve messages before publication. StatusPulse combines uptime monitoring, public status pages, and AI-assisted incident management. See how StatusPulse’s monitoring and incident tools bring these tasks together.
When an Uptime Monitoring Platform Fits: What to Evaluate
A focused uptime service fits when your main need is to detect whether selected websites, APIs, or certificates meet defined availability conditions and route alerts to your team. If you also need detailed traces, logs, or application diagnostics, an observability platform or specialist tool may be a better fit. Some teams use both: uptime checks for external availability, deeper tools for diagnosis.
Choose based on the operational gap you need to close, not the length of a feature list. For uptime monitoring for web applications, compare tools against the checks and response workflow your service actually requires.
Compare tools by operational fit, not feature count
A narrow monitor may be enough for a small service that needs basic endpoint availability checks. A larger application with complex dependencies may need observability tooling to trace a failure across services and inspect logs or metrics. Before comparing vendors, verify their current check types, limits, incident features, and pricing directly. Don’t assume that similar labels mean equivalent coverage.
Use these questions to structure an evaluation:
- Monitoring coverage: Can it monitor the website, API endpoints, and SSL certificates you rely on? Confirm the actual validation depth.
- Communication: Do you need a public status page, and can the team maintain incident updates in the same workflow?
- Incident handling: Will alerts reach clear owners, and would AI-assisted drafting or impact summaries help, with a human reviewing updates?
- Diagnostics: Do you need traces, logs, or application-level investigation beyond availability checks?
Assess transparency, hosting choice, and communication needs
Hosting region is a practical selection criterion. Consider where you need monitoring data hosted and how that choice fits your organization’s requirements. Ask providers about their available hosting options and assess them against your own requirements rather than assuming one location suits every team.
Pricing structure also matters as usage grows. Compare what each plan includes, which usage limits apply, and whether costs change with the number of checks, monitored services, or users. StatusPulse is a cloud-based platform offering uptime and API monitoring, SSL certificate monitoring, public status pages, and AI-assisted incident management. These tools can suit teams that want monitoring and incident communication in one workflow, while teams needing deep traces or logs should also evaluate tools built for those needs.
Review StatusPulse monitoring and status pages as one option for bringing availability checks and incident communication together.
Build a Monitoring Workflow Your Team Can Trust
Effective uptime monitoring for web applications starts with checks that reflect important user actions, not just server reachability. Match check frequency and locations to service impact, define response conditions that limit noise, and test alert delivery before relying on it.
Monitoring becomes more useful when detection leads to clear ownership and accurate updates. Review false positives and missed incidents after real events, and tell users what you’ve confirmed without guessing at the cause.
StatusPulse brings uptime and API monitoring, SSL certificate monitoring, public status pages, and AI-assisted incident management into one cloud-based platform. If that combination fits your team’s workflow, explore StatusPulse’s monitoring and status page tools.
Start with the paths your users depend on, then improve your checks as you learn. Clear signals make the next incident easier to handle.
Frequently Asked Questions
What is uptime monitoring for web applications?
Uptime monitoring for web applications repeatedly checks whether a configured endpoint meets a defined availability condition. Depending on the check, it may detect an unreachable service or an unexpected response. A passing result only confirms the condition tested. It doesn’t prove every feature works or every user has a good experience. Pair endpoint checks with application-specific and API checks that cover critical functions.
How is application uptime monitoring different from server monitoring?
Server monitoring tracks infrastructure signals, such as host or service health. Application uptime monitoring checks whether a user-facing endpoint meets its expected condition. A healthy server can still serve a failing application route. Use external checks to establish whether the service is reachable, then use infrastructure telemetry, logs, or traces to investigate why a failure occurred. The two approaches complement each other; neither replaces the other.
How often should I check web application uptime?
Set check frequency according to service criticality, acceptable detection delay, and the operational cost of checks. There’s no universal interval for every application. You might check a customer-facing checkout more frequently than a low-priority internal page, provided the team can respond to resulting alerts. Test the configuration, review alert noise, and confirm that your monitoring provider supports the frequency and alert conditions your response process needs.
Can uptime monitoring detect API failures?
Yes, if a check targets the relevant API endpoint and validates a meaningful response condition. A basic reachability check may miss incorrect data, authorization failures, or problems across a dependent workflow. Define what failure means for each API, such as an unexpected status or response value. Then confirm the monitoring service supports that test depth before relying on it to detect the failures that matter to your application.
What should I do when an uptime alert fires?
First verify that the alert reflects a current, user-impacting problem. Recheck the endpoint, compare relevant application telemetry and dependency status, then assign an incident owner and follow the runbook. Communicate confirmed impact without presenting an unverified cause as fact. After recovery, review whether the alert was accurate, whether a failure was missed, and whether your checks, ownership, or runbook need updating.
Is uptime monitoring enough to measure application reliability?
No. Uptime monitoring provides an availability signal, but it doesn’t describe every aspect of reliability. A check may miss slow interactions, partial failures, degraded data, or problems affecting only a specific group of users. Combine availability checks with monitoring suited to your application, such as application diagnostics or user-experience measurements. Be clear about what each signal can establish and where it leaves blind spots.


