

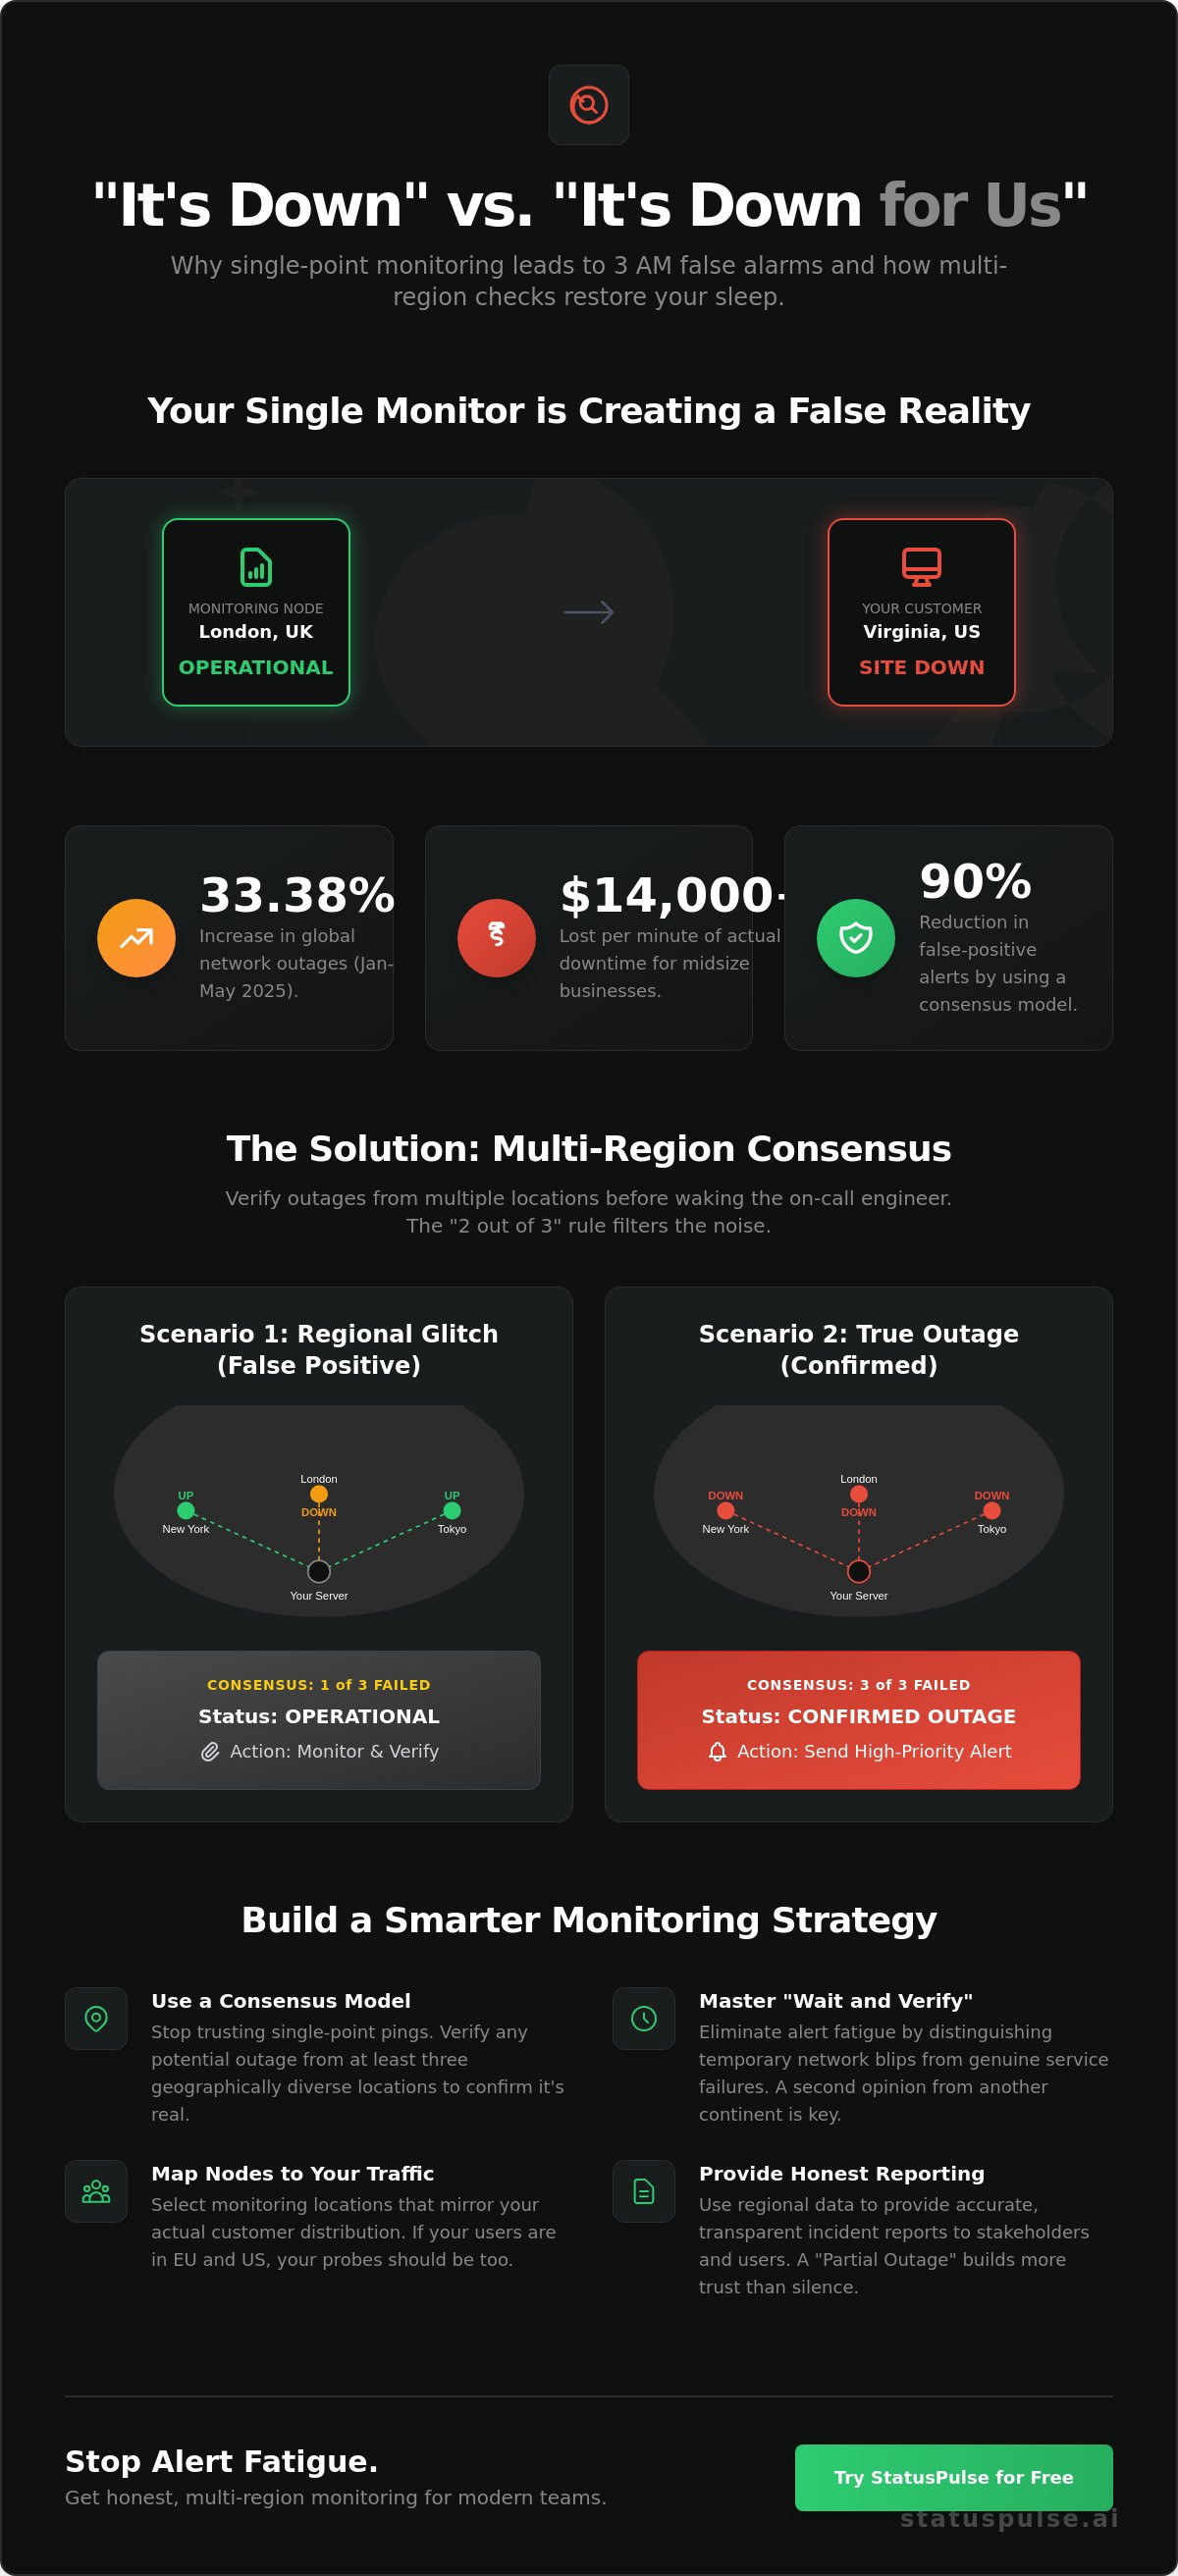
It is 3:03 AM. Your phone screams. You scramble to your desk, heart racing, only to find that your site is perfectly fine for everyone but a single router in Northern Virginia. This is the exhausting reality of monitoring without Multi-Region Uptime Checks: How to Tell "It's Down" from "It's Down for Us".
You shouldn't have to lose sleep over a regional ISP glitch. We agree that alert fatigue is a silent killer of engineering productivity. This is a growing problem. Global network outages increased by 33.38% between January and May 2025. It is time to stop treating uptime as a binary state. In this guide, you'll learn how to implement multi-node verification to reduce false positives by 90%. We'll show you how to build a monitoring setup that respects regional nuances and provides the clarity you need for stakeholder reporting. We are moving away from the loud, messy alerts of industry incumbents. We are moving toward quiet, data-backed confidence. No fluff. Just better visibility.
Key Takeaways
- Stop trusting single-point pings. They often lie. Use a consensus model to verify your status from three or more geographic locations instead.
- Master the "Wait and Verify" strategy to eliminate alert fatigue. This approach distinguishes between temporary regional routing blips and actual service failures.
- Implement Multi-Region Uptime Checks: How to Tell "It's Down" from "It's Down for Us" to provide accurate, data-backed incident reports to your stakeholders.
- Select monitoring nodes that map directly to your real-world traffic patterns. Defining specific criteria for what constitutes an outage ensures your SLA remains honest and reachable.
- Discover why professional monitoring doesn't require enterprise bloat. StatusPulse provides a lean, GDPR-native alternative that focuses on what matters.
The Myth of Global Uptime: 'Down' vs 'Down for Us'
Uptime is not a binary state. Most legacy tools treat it like a light switch. On or off. This is a dangerous oversimplification for SaaS teams. If your monitoring node is in London and a backbone fiber cut happens in Virginia, your dashboard stays green. Meanwhile, your US customers are staring at a timeout. This is why you need Multi-Region Uptime Checks: How to Tell "It's Down" from "It's Down for Us".
A true outage means the origin is dead. The database is locked. The code is throwing 500s. That is "Down". But often, the problem is "Down for Us". This involves regional ISP outages, BGP routing errors, or CDN edge failures. In 2025, global network outages rose by 33.38%. Many of these were regional. If your team wakes up for every regional blip, they will burn out. Alert fatigue isn't just annoying. It's expensive. Midsize businesses lose over $14,000 per minute during actual downtime. You can't afford to ignore the signal because of too much noise. Using Multi-Region Uptime Checks: How to Tell "It's Down" from "It's Down for Us" allows you to verify an incident from multiple nodes before waking the on-call engineer.
Traditional website monitoring often relies on a single vantage point. This creates a narrow, distorted view of reality. It's time to look at the bigger picture.
Why Single-Location Monitoring Fails
Network flapping happens when a connection is intermittent. A single monitor might catch a "down" packet and scream. Ten seconds later, it is "up". This creates a jagged line of false alerts. Local network congestion at the monitoring data center can also trigger a fail. Your office IP is another trap. You might see the site because you are on the same local network or CDN edge. Your customers in a different hemisphere are seeing something else entirely. One perspective is never enough.
The Psychology of Incident Transparency
Users are smart. They know the internet is complex. When a regional glitch happens, an "Operational" status feels like a lie. It erodes trust. Labeling an event as a "Partial Outage" is a better move. It shows you are paying attention. Regional reporting proves you care about the details. Honest communication is a retention strategy. At StatusPulse, we believe in this transparency. We built a tool that values integrity over flashiness. It is about giving your users the truth, not a marketing version of it.
How Multi-Region Uptime Checks Work
Monitoring is a team sport. A single probe is just an opinion. Multi-region monitoring relies on a consensus model. If one node in London reports a timeout, it's a suspicion. If nodes in New York and Tokyo agree, it's a confirmed incident. This is the technical foundation of Multi-Region Uptime Checks: How to Tell "It's Down" from "It's Down for Us". By distributing probes across North America, Europe, and Asia Pacific, we eliminate the observer effect. This occurs when the monitoring tool's own network environment causes a false alarm. You shouldn't be alerted because a data center in Ohio has a bad afternoon.
Slow is the new down. But slow isn't always a total failure. High latency in Singapore shouldn't trigger the same alarm as a database crash in Dublin. Regional checks help you see this nuance. You can set thresholds that distinguish a sluggish network from a dead server. This is similar to how architectural patterns like Multi-region HA in Google Cloud ensure reliability by distributing workloads geographically. If you want a monitoring setup that respects your time, try StatusPulse for honest, multi-region reporting.
The Mechanics of Regional Probes
Synthetic monitoring is the backbone here. It doesn't wait for a user to experience a failure. Instead, it proactively simulates traffic from diverse global networks. These probes are meticulous. They check every step of the connection, from DNS resolution to the final byte of the payload. TTL values and DNS propagation delays often cause regional "ghost" outages. A user in Paris might see a stale IP while a user in Berlin sees the update. Regional probes catch these discrepancies before they become support tickets. They simulate real traffic patterns without the privacy concerns of tracking real users.
Consensus Algorithms for Uptime
Consensus algorithms are the secret to quiet nights. The "2 out of 3" rule is the gold standard. If a majority of nodes across different Tier 1 providers report a failure, the alert is real. This logic filters out the noise of a single ISP's routing error. It allows for a much lower time-to-alert. You don't need to wait for three consecutive failures from one location. You just need a second opinion from another continent. This approach reduces false positives by 90% in most DevOps environments. It keeps the focus on true availability rather than regional hiccups.
Solving the 'False Positive' Problem in DevOps
Alert fatigue is a productivity killer. When your phone screams at 3:00 AM for a two-second blip, you lose more than just sleep. You lose trust in your monitoring stack. Solving this requires a "Wait and Verify" strategy. Instead of alerting on the first failed packet, your system should wait for a second node to confirm the failure. This is the core logic behind Multi-Region Uptime Checks: How to Tell "It's Down" from "It's Down for Us". If London says it is down, but Frankfurt and New York say it is up, you don't need to wake up. It is a regional routing issue, not a service catastrophe.
The check interval you choose defines your visibility. A five-minute check is a lifetime in the SaaS world. By the time you get the alert, you've already lost five minutes of revenue. For a midsize business, that is roughly $70,000 in lost value based on the $14,000 per minute average cost of downtime in 2025. A one-minute check is the standard for modern teams. It catches micro-outages without the lag. Frequency alone isn't enough; you need smart retry logic. If a check fails, the system should immediately retry from a different region. This prevents a single congested router or a local ISP glitch from triggering a company-wide emergency. Multi-Region Uptime Checks: How to Tell "It's Down" from "It's Down for Us" ensures that your team only responds to verified, impactful events.
Gray failures are the hardest to catch. These occur when your server returns a 200 OK status code, but the page is actually broken. Perhaps the database connection timed out after the headers were sent. Or maybe a regional CDN edge is serving a zero-byte file. Multi-region checks identify these discrepancies by comparing the payload and response time across global nodes. If the response looks different in Tokyo than it does in Paris, you have a regional integrity problem.
Common Culprits of Ghost Outages
- BGP route leaks: These divert traffic through misconfigured ISPs. In late 2025, a major outage affected over 3,500 companies because of routing errors. To those users, the site was down. To everyone else, it was perfect.
- Expired SSL certificates: Sometimes a regional cache holds an old certificate chain. Specific browsers in that area will block access while others remain unaffected.
- CDN cache-miss storms: A sudden spike in regional traffic can overwhelm a local edge server. This causes latency that looks like a total outage to a single-point monitor.
Configuring Alert Thresholds
Sensitivity should match your user base. If 80% of your customers are in Europe, your European nodes should have a higher sensitivity than your Australian ones. You don't always need to wake the whole team. Set your thresholds so that a regional blip alerts a specific Slack channel, while a confirmed global outage triggers the "all hands" alarm. Use API monitoring to verify that your backend is actually processing requests. This adds a layer of truth that simple pings can't provide. At StatusPulse, we believe in monitoring that respects your time and your intelligence.
Setting Up Your Multi-Region Monitoring Strategy
Setting up a monitoring strategy shouldn't be complex. It should be logical. You need a system that reflects how your users actually interact with your site. This is where you implement Multi-Region Uptime Checks: How to Tell "It's Down" from "It's Down for Us". It starts with data, not guesswork. Most incumbents hide this simplicity behind layers of enterprise bloat. We prefer a grounded approach that respects your time and your budget.
Step 1: Map your traffic. Look at your logs. If 70% of your users are in the EU, focus your nodes there. Don't pay for monitoring in regions you don't serve. Step 2: Define your 'Down' criteria. We suggest a consensus model. Two out of three nodes must fail before you trigger an alert. This protects your team from 3:00 AM false alarms. Step 3: Connect to a public status page. Transparency builds trust. Step 4: Automate your incident management. Every second counts when downtime costs reach $14,000 per minute for midsize businesses. When you master Multi-Region Uptime Checks: How to Tell "It's Down" from "It's Down for Us", you transform your DevOps culture from reactive to proactive.
If you're ready to stop guessing and start knowing, get started with StatusPulse today.
Selecting Your Monitoring Regions
Privacy is a technical virtue. This is why being EU-hosted and GDPR-native is non-negotiable for modern teams. New regulations like NIS2 in Europe make continuous monitoring a mandatory requirement for many organizations. You need nodes that sit close to your users to measure true latency. High-latency backbones can mimic outages. If you only monitor from one US-based provider, you're missing the reality of your global audience. Balance your coverage. Focus on your high-traffic zones first to keep costs honestly priced.
Automating Communication with AI
Communication is the hardest part of an incident. Your engineers are busy fixing the core problem. They shouldn't be drafting emails or Slack updates. Our AI integration changes the rhythm of incident response. Claude drafts... You press send. It's that simple. The AI summarizes technical logs into clear updates for non-technical stakeholders. This proactive approach reduces support tickets by up to 50% during an event. It keeps everyone informed without slowing down the recovery. Honest communication is your best defense against customer churn.
StatusPulse: Honest Monitoring for Modern Teams
Monitoring shouldn't be a luxury reserved for enterprise budgets. We built StatusPulse as a direct rebellion against the bloat of industry incumbents. Some competitors charge $210 per month for core features. Others start at $10 but scale to over $2,800 as your needs grow. We find that pricing model exhausting. We believe in being honestly priced. For us, that means €5 per month. Not $29. Not $210. This price point includes the tools you need to master Multi-Region Uptime Checks: How to Tell "It's Down" from "It's Down for Us". You get professional grade visibility without the corporate tax.
Privacy is not a marketing afterthought for us. We are EU-hosted and GDPR-native. This is a deliberate choice for developers who care about regional compliance and data integrity. In a world where global network outages increased by 33.38% in early 2025, your monitoring needs to be as resilient as your infrastructure. We provide one-minute check intervals as a standard. We don't make you wait five minutes to discover a problem that is costing you $14,000 every sixty seconds. StatusPulse gives you the technical precision of an enterprise tool with the soul of a small, focused team. We prioritize the details that matter to people who actually build things. This is how we help you implement Multi-Region Uptime Checks: How to Tell "It's Down" from "It's Down for Us" with total confidence.
Simple Setup. No Surprises.
Four plans. No hidden fees. We stripped away the fluff to create a dashboard that works. You can have native SSL and uptime monitoring running in under 60 seconds. There are no complex subordinate clauses in our terms. You simply add your URL, select your regions, and go. We handle the heavy lifting of global consensus so you can focus on your code. It is straightforward, reliable, and easy to understand.
Built for Developers who Care
We are a small team that cares about getting the details right. Our incident management tools are built for transparency. When things break, our AI integration helps you stay human. Claude drafts the updates. You press send. This keeps your communication honest and your stakeholders calm. Our status pages are markdown-ready and look great on any device. We don't just sell software. We provide a way to build trust with your users through better visibility. If you are tired of faceless corporations and complex pricing, join us at StatusPulse.
Build a More Resilient Monitoring Culture
You now have the technical blueprint for a more accurate monitoring stack. Availability is no longer a simple binary state. It is a regional conversation that requires a global perspective. By shifting to a consensus model, you eliminate the noise that leads to engineer burnout. You ensure that your team only responds to events that actually impact your bottom line. Implementing Multi-Region Uptime Checks: How to Tell "It's Down" from "It's Down for Us" gives you the clarity to lead through any incident with quiet confidence.
We believe professional monitoring should be accessible to every team. StatusPulse offers EU-hosted reliability and AI-assisted incident drafting without the enterprise bloat. Our platform is built by developers who care about the small details that make a big difference. You get one-minute checks and transparent status pages that respect your users' intelligence. Stop fighting with complex pricing and start focusing on your product. Start monitoring from €5/month with StatusPulse. Your users deserve the truth, and your team deserves a good night's rest. It is time to build something better.
Frequently Asked Questions
What is the difference between latency and downtime?
Downtime is a total failure where your server doesn't respond at all. Latency is the delay in that response. A site can be technically up but so slow that users abandon it. This is often called a gray failure. Multi-region monitoring helps you set specific thresholds. You can distinguish a 500ms response in Paris from a 10 second timeout in Sydney. Monitoring both metrics ensures you catch performance degradation before it becomes a total service failure.
How many regions should I monitor to avoid false positives?
You should monitor at least three distinct geographic regions. This provides a clear tie-breaker when a single node reports a failure. Using Multi-Region Uptime Checks: How to Tell "It's Down" from "It's Down for Us" requires this triangulation. If only one node fails, it is likely a regional ISP glitch. If two or more fail, you have a confirmed incident. This strategy keeps your on-call engineers happy and focused on real problems.
Can a website be down in one country but up in another?
Yes, this happens frequently due to BGP route leaks or local CDN edge failures. A major AWS outage in October 2025 showed that regional infrastructure can fail independently. Users in one territory might see a 404 while others experience perfect service. Regional probes are the only way to detect these localized ghost outages before your support team is overwhelmed. It is the difference between a global crisis and a regional blip.
What happens if my monitoring service itself goes down?
A professional monitoring service uses its own multi-region redundancy to prevent monitor downtime. At StatusPulse, we distribute our infrastructure to ensure high availability. If a specific monitoring node fails, our system automatically fails over to a healthy one. This prevents false positives caused by our own network. You get a reliable signal even when the internet is messy. We prioritize integrity over flashiness in our own stack.
Does multi-region monitoring affect my website's performance?
The performance impact is negligible. Uptime checks are lightweight HEAD or GET requests that consume minimal server resources. They don't load heavy assets like images or scripts. A one-minute check from three regions adds roughly 4,320 requests per day. For a production app, this is a tiny fraction of normal traffic. It provides massive visibility for almost zero overhead. Your server won't even notice the extra load.
Why is an EU-hosted monitoring service better for my SaaS?
EU-hosting ensures your data remains under strict GDPR-native protections. This is a core virtue for privacy-first developers. Regulations like NIS2, which became active for many organizations in 2024, make continuous monitoring a mandatory requirement. Using an EU-based provider simplifies your compliance audits. You don't have to worry about data being processed under less stringent privacy laws in other jurisdictions. It is about simple, ethical monitoring that respects your users.
How often should I run uptime checks for a production app?
You should run checks every 60 seconds. A five-minute interval is too slow for modern SaaS. If your site goes down immediately after a check, you could be offline for 300 seconds before you even get an alert. For a midsize business, this delay costs over $70,000 based on average downtime costs from 2025. One-minute intervals are the professional standard for reliability and honest communication with your stakeholders.
What is the 'consensus' rule in uptime monitoring?
The consensus rule is a logic gate that requires multiple nodes to agree before an alert is sent. It is the secret to reducing false positives by 90%. Usually, this is a 2 out of 3 threshold. This rule is a key part of Multi-Region Uptime Checks: How to Tell "It's Down" from "It's Down for Us". It filters out the noise of a single Tier 1 provider having a bad day.


