
It's 3:00 AM on a Tuesday. Your pager screams because a disk space threshold finally hit 95%, triggering a hard failure that just took your entire API offline. You spend the next four hours in a high-pressure war room. Later, you realize the "sudden" spike actually began as a subtle, sub-threshold trend nearly eighteen hours ago. This is why technical teams are moving toward ML-Powered Anomaly Detection That Catches Trouble Before a Hard Failure.
We've all lived this scenario. Static thresholds are blunt instruments that often lead to alert fatigue or silence until a system collapses. You shouldn't have to choose between drowning in noisy notifications and waking up to a catastrophe. There's a more precise way to monitor complex microservices without the manual overhead of constant tuning and configuration.
In this article, you'll learn how machine learning identifies subtle system deviations to provide the lead time necessary for proactive incident management. We'll examine how to bridge the gap between detection and automated incident communication. This approach helps reduce your Mean Time to Detection (MTTD) and ensures you can resolve issues during business hours instead of at midnight.
Key Takeaways
- Understand why static thresholds fail in dynamic environments by ignoring seasonality and auto-scaling patterns.
- Learn how unsupervised learning models identify "unknown unknowns" in server metrics without the burden of manual configuration.
- Discover how ML-Powered Anomaly Detection That Catches Trouble Before a Hard Failure utilizes time-series decomposition to separate noise from genuine signals.
- Build a proactive incident workflow using tiered alerting to resolve subtle deviations during business hours and reduce alert fatigue.
- Integrate anomaly signals with transparent status pages and regional hosting to maintain user trust and data sovereignty.
The Limitation of Static Thresholds in Modern Stacks
Static thresholds are blunt tools. They assume your system operates within a fixed range regardless of time, traffic, or architectural changes. In a dynamic, auto-scaling environment, a hard limit at 95% CPU usage might catch a total collapse. It won't tell you why your database is struggling at 3:00 AM when traffic is at its lowest. This is the core problem with reactive monitoring. It waits for the house to catch fire before sounding the alarm.
The "Flapping Alert" is a classic example of this failure. Your monitoring tool triggers at 90% CPU usage during your 2:00 PM peak. It's noise; you ignore it. But when that same 90% occurs at 2:00 AM during a scheduled maintenance window, it's a critical indicator of a runaway process. Static rules are blind to this context. By contrast, anomaly detection uses historical data to model expected behavior. It identifies deviations that don't yet violate hard limits but signal an impending crisis. Implementing ML-Powered Anomaly Detection That Catches Trouble Before a Hard Failure allows you to see these patterns before they become customer-facing outages.
There's a trade-off here. Static rules are easy to audit and simple to explain to a management team. Machine learning is contextual and significantly more powerful, but it requires data maturity. You need a consistent stream of telemetry to train a model that actually understands your stack. Without that history, the model can't distinguish between a deployment spike and a genuine threat.
The Cost of Reactive Monitoring
When you rely solely on static thresholds, you're choosing a reactive posture. Hard failures lead to "all-hands-on-deck" fire drills. These incidents disrupt planned sprints and burn out your engineering team. If the first notification of an outage comes from a customer support ticket rather than your own monitoring, you've already lost the battle for trust. Latent failures, such as slow-growing memory leaks or creeping latency, are invisible to binary "Up/Down" checks until the service finally dies. A platform like StatusPulse helps bridge this gap by connecting monitoring signals to transparent incident management.
Why 2026 Requires Contextual Observability
Modern stacks are no longer monolithic. Distributed tracing and API-first architectures mean that failure in one microservice can ripple through the entire system in unpredictable ways. Seasonality also plays a role. Daily and weekly cycles make simple min/max thresholds obsolete. A contextual anomaly is a deviation that is only abnormal within its specific temporal or architectural frame. ML-Powered Anomaly Detection That Catches Trouble Before a Hard Failure provides the intelligence needed to distinguish between a busy Monday morning and a catastrophic failure on a quiet Sunday night.
How ML Models Distinguish Noise from Impending Failure
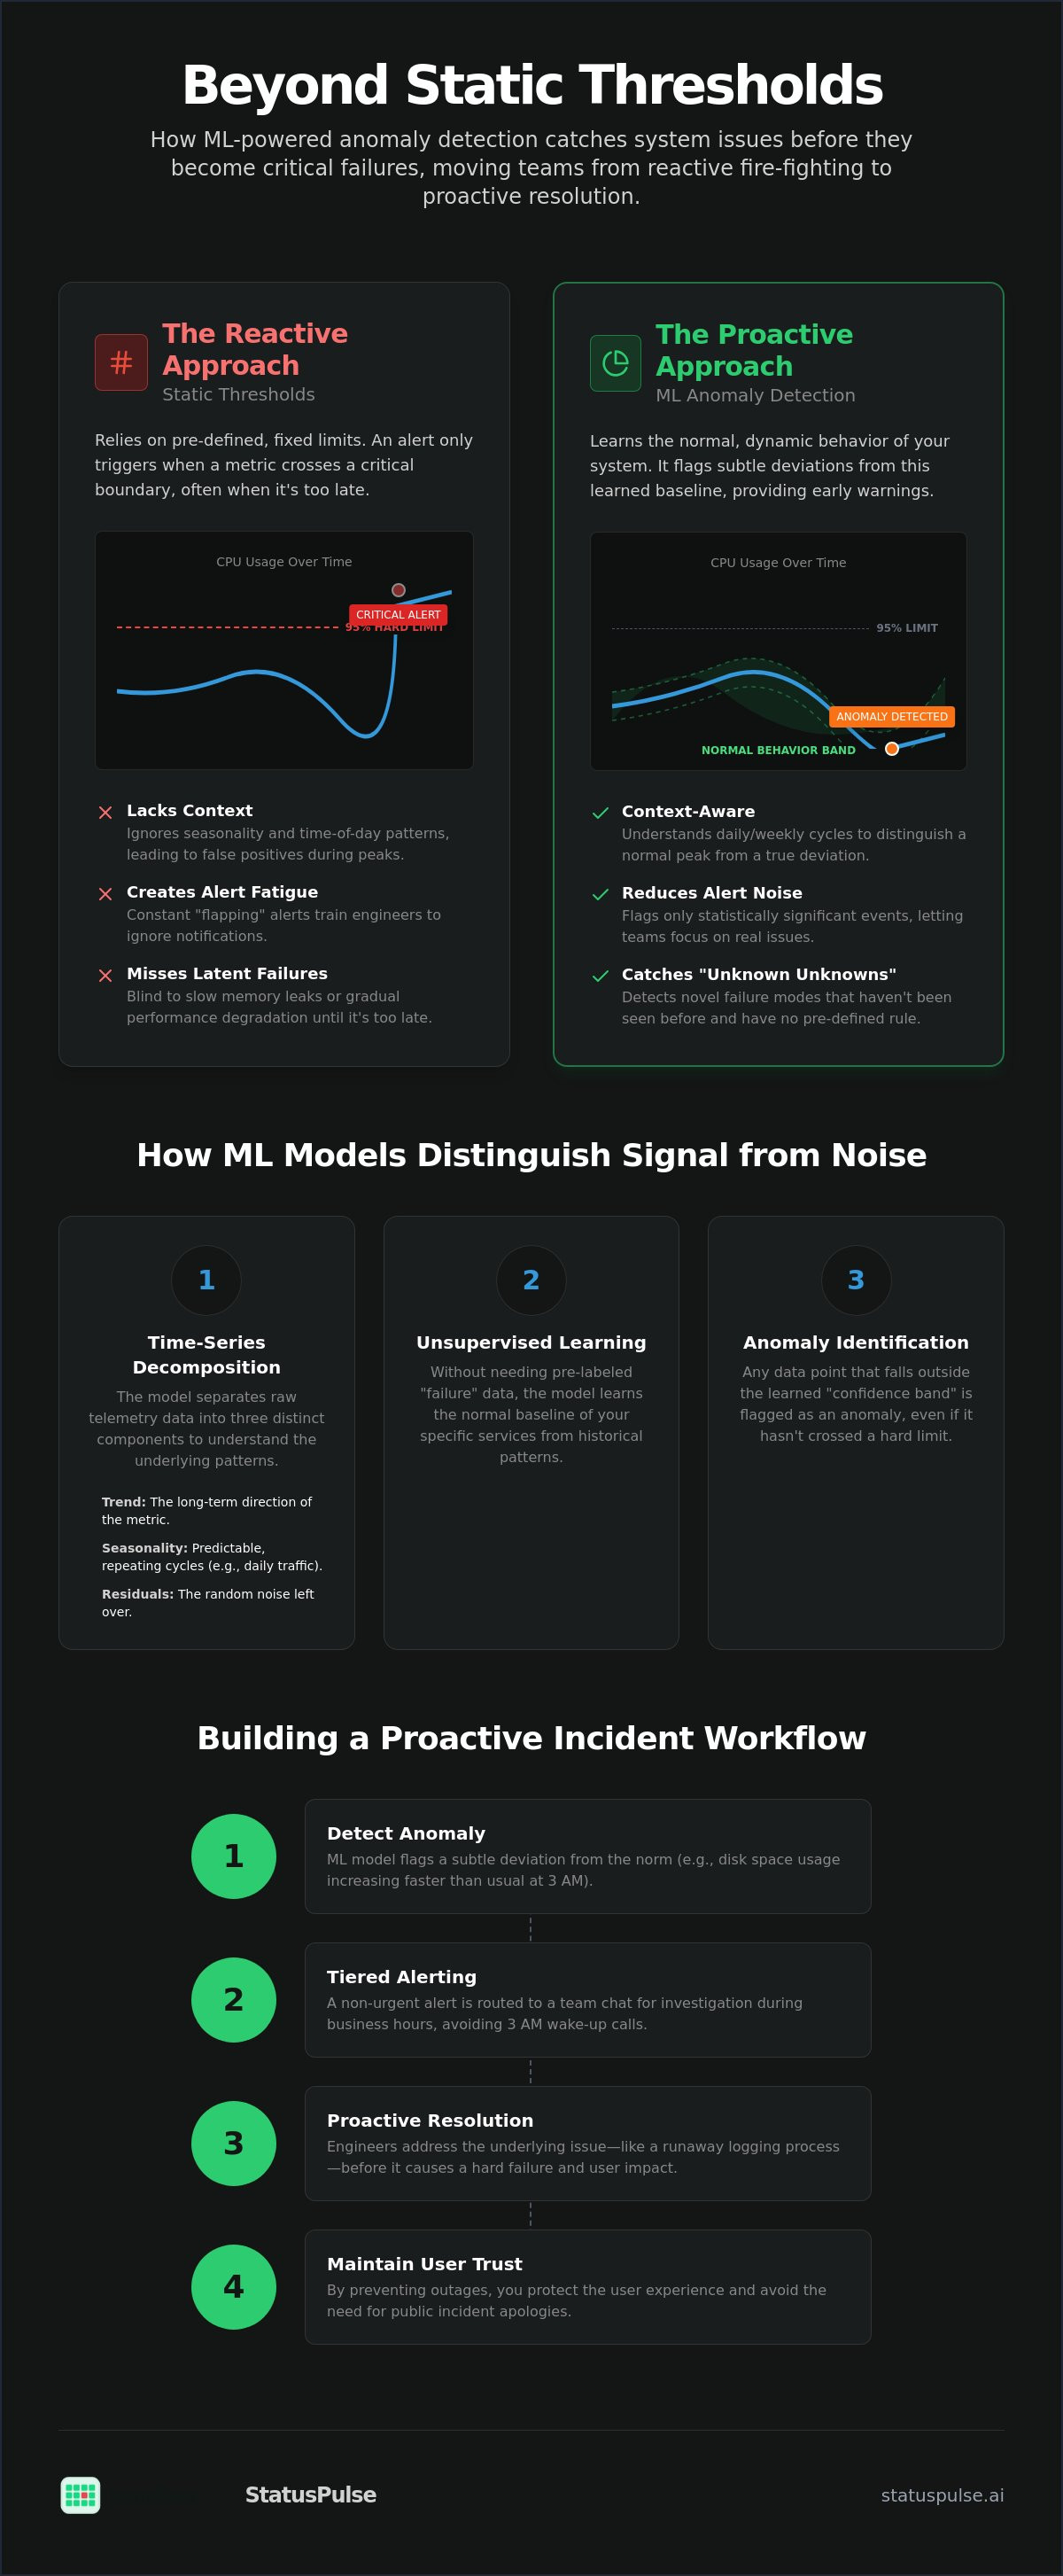
Distinguishing between a routine traffic surge and a failing load balancer requires more than a simple threshold. It requires understanding the "shape" of your data. ML models don't just look at a single data point; they analyze the context of the entire telemetry stream. This is typically achieved through time-series decomposition. By breaking data into three parts—Trend, Seasonality, and Residuals—systems isolate the underlying signals that actually matter.
When applying machine learning for anomaly detection, unsupervised learning is usually the preferred choice. You don't always know what a failure looks like until it happens. Unsupervised models learn the baseline of your microservices without needing labeled "failure" data. This makes them ideal for detecting "unknown unknowns" that traditional monitoring misses. It is a fundamental component of ML-Powered Anomaly Detection That Catches Trouble Before a Hard Failure.
The visualization of this process often relies on Confidence Bands. These represent the delta between actual performance and the predicted baseline. If a metric stays within the band, the system remains quiet. When it drifts outside, the model flags an anomaly. For short-term trajectories, auto-regressive models like ARIMA are efficient for predictable data. Neural Networks handle high-cardinality API interactions more effectively. This layered approach ensures that your monitoring is both sensitive and accurate.
Time-Series Analysis: The Core Mechanism
Models must account for daily and weekly traffic patterns to prevent false alarms during peak hours. A Point Anomaly is a single, sharp spike, like a brief network timeout. Collective Anomalies are more dangerous. They represent a sustained shift in the baseline, such as a slow memory leak that gradually increases resource consumption. Modern algorithms also account for "holidays" or planned marketing events. If the model knows a promotion is starting, it won't alert on the expected traffic surge.
From Detection to Forecasting
The ultimate goal is increasing "Lead Time." This is the interval between the first anomaly signal and actual service degradation. By focusing on Residuals—the data left over after removing trend and seasonality—ML can identify deviations hours before a hard limit is reached. For example, predicting disk space exhaustion based on current consumption rates allows you to scale before a crash occurs. If you want to move from reactive fire drills to proactive management, integrating AI-driven insights into your workflow is a logical next step.
Comparing Statistical Baselines with Neural Anomaly Detection
Simple statistics like Standard Deviation are the workhorses of monitoring. They are ideal for low-cardinality metrics with predictable behavior, such as steady-state disk usage. Neural Networks, specifically Long Short-Term Memory (LSTM) or Recurrent Neural Networks (RNN), are built for something different. They are the engine behind ML-Powered Anomaly Detection That Catches Trouble Before a Hard Failure. They excel at high-cardinality data where API interactions are complex and non-linear.
Choosing the right model involves weighing computational overhead against the value of the signal. Deep learning requires significant CPU and memory to process thousands of telemetry streams in real-time. For many teams, the simple statistical approach is "good enough" for 80% of their metrics. You only deploy the heavy machinery of ML-Powered Anomaly Detection That Catches Trouble Before a Hard Failure where the cost of a missed signal outweighs the cost of the compute. This honesty about resource usage is something traditional enterprise vendors often gloss over.
Interpretability vs. Accuracy
SREs often face the "Black Box" problem. A neural network might be highly accurate at predicting a failure, but if it can't explain why it flagged a specific microservice, the alert is difficult to act on. Root Cause Analysis (RCA) features that correlate anomalies across different system layers are vital for building trust. Being able to see that a latency spike in the checkout service correlates with a residual trend in the payment gateway provides the context needed for a fast fix. A model you cannot trust is a model you will eventually disable.
The False Positive Trade-off
Tuning sensitivity is a constant battle. Set the model too high, and you risk "The Boy Who Cried Wolf," leading to alert fatigue. Set it too low, and you miss the subtle deviations that precede a crash. Human feedback loops help solve this by allowing engineers to confirm or reject anomalies, which retrains the model for better precision over time. StatusPulse supports this by integrating AI incident management with human-in-the-loop verification to ensure your public communication remains accurate and honest. This ensures that your status page isn't just a collection of automated noise, but a reliable source of truth for your users.
Implementing a Proactive Incident Workflow
Detection is only half the battle. If you don't have a structured response plan, a high-fidelity signal is just more noise on a dashboard. Too many teams treat machine learning as a "set and forget" feature. Instead, it should act as the trigger for a specific investigation process that begins long before a hard threshold is crossed. This transition from reactive to proactive is the primary benefit of ML-Powered Anomaly Detection That Catches Trouble Before a Hard Failure.
The first step is defining your "Golden Signals." Focus your ML monitoring on Latency, Errors, Traffic, and Saturation. These metrics provide the most reliable data for identifying system health trends. Once these are established, set up tiered alerting. Subtle anomalies should go to a dedicated Slack or Teams channel for non-urgent review. Hard failures and total service losses still belong in PagerDuty. This separation protects your team from alert fatigue while ensuring that emerging issues are addressed during business hours.
The lead time provided by ML-Powered Anomaly Detection That Catches Trouble Before a Hard Failure is your most valuable asset. Use these minutes or hours to investigate traces and logs without the high-pressure environment of a total outage. If a deviation looks like a legitimate threat, draft a "pre-incident" update. Finally, always perform a brief post-mortem on every flagged anomaly. Use these sessions to adjust model sensitivity and refine your alerting logic. This iterative approach turns your monitoring tool into a trusted technical assistant.
The "Pre-Incident" Communication Strategy
Acknowledging a subtle deviation on a public status page builds significantly more trust than waiting for a total system crash. It demonstrates that your team is observant and honest. You don't need to share raw telemetry; instead, use AI to summarize technical anomalies into plain language. You can find specific templates in our guide on how to draft honest incident updates with AI. This proactive transparency reassures your users and stakeholders that you're managing the situation before it impacts their workflow.
Bridging the Gap Between SRE and Customer Support
Support teams shouldn't find out about system issues from customer complaints. By automating internal alerts based on ML-detected performance regressions, you can brief your support staff before the first ticket is ever filed. This is particularly effective for API monitoring, where subtle latency increases often signal an impending resource exhaustion. When support knows an investigation is already underway, they can provide faster, more accurate responses to users. If you're ready to stop reacting to fires and start preventing them, automating your incident management with a unified platform is the most efficient path forward.
StatusPulse: Integrating Anomaly Signals into Transparent Communication
StatusPulse is built on the belief that monitoring shouldn't exist in a vacuum. We provide a native integration of uptime monitoring and ML-assisted incident management. This unified flow ensures that when a signal is detected, the path to communication is already open. It's a straightforward approach to a complex problem. By combining these layers, you move from raw data to actionable trust.
Data sovereignty is a core virtue, not a marketing afterthought. We offer a choice of EU or US hosting to support your specific regulatory needs and GDPR compliance. This ensures your telemetry stays where you want it. Our pricing model follows the same principled path. We offer flat, transparent rates without per-subscriber fees or an "enterprise tax" for ML features. You get full access to the platform's capabilities without hidden costs.
The platform utilizes AI-powered incident drafting to save you time. It converts complex ML signals into honest, human-readable updates. This is the final step in ML-Powered Anomaly Detection That Catches Trouble Before a Hard Failure. It moves you from a technical alert to a clear statement of truth for your users. You maintain human agency by reviewing and refining every update before it goes public.
Why Developers Choose StatusPulse
StatusPulse is built by specialists for specialists. We avoid the corporate bloat and complex pricing models of industry incumbents. Our interface is minimalist and high-performance. While many enterprise tools focus solely on the technical depth of "Observability," we prioritize Reliability and Trust. We give you the tools to monitor your stack and the platform to talk about it honestly. It's about being a fair and ethical alternative in a market of faceless corporations.
Getting Started with Proactive Monitoring
You can enable 1-minute checks and ML baselining in under five minutes. It's a low-friction way to start building a historical data set for your microservices. We're honest about the use case. If you're running a small, static marketing site, simple uptime checks are likely enough. For modern SaaS applications with dynamic traffic, ML-Powered Anomaly Detection That Catches Trouble Before a Hard Failure is the standard for maintaining high availability. Start monitoring with StatusPulse today and catch trouble before it impacts your users.
Building a Signal-Driven Reliability Culture
Static thresholds are no longer sufficient for dynamic, distributed systems. By moving toward a contextual observability model, you can distinguish between routine traffic cycles and genuine system decay. This shift provides the lead time necessary to investigate issues without the pressure of an active outage. Implementing ML-Powered Anomaly Detection That Catches Trouble Before a Hard Failure is ultimately about reclaiming your time and protecting your user's trust.
StatusPulse makes this transition straightforward by combining monitoring, status pages, and AI-assisted incident communication into one platform. We offer predictable, flat-rate pricing and a choice between EU or US data hosting to support your regional sovereignty needs. You don't have to wait for the next hard failure to build a more resilient system. Start your 14-day free trial of StatusPulse and see how proactive monitoring can change your engineering workflow.
Frequently Asked Questions
What is the difference between threshold-based alerting and anomaly detection?
Threshold-based alerting triggers when a metric crosses a pre-defined static limit. It is a binary check that ignores time and traffic context. Anomaly detection uses machine learning to identify deviations from expected behavior based on historical patterns. This allows for ML-Powered Anomaly Detection That Catches Trouble Before a Hard Failure by spotting issues that haven't hit a critical limit yet.
Does ML-powered anomaly detection require a lot of historical data to work?
Most models require at least one to two weeks of telemetry to establish a reliable baseline for seasonality. However, basic trend detection can start much earlier. The accuracy improves as the dataset grows. This allows the system to distinguish between a routine Monday morning traffic surge and a genuine performance regression that requires your attention.
How does anomaly detection help reduce alert fatigue for DevOps teams?
It reduces fatigue by filtering out expected spikes, such as peak-hour traffic or scheduled backups. Instead of receiving alerts for every minor threshold breach, your team only gets notified when a metric deviates significantly from its normal context. This ensures that notifications are high-priority and actionable rather than just background noise that engineers eventually ignore.
Can machine learning detect silent API failures that return a 200 OK status?
Yes, machine learning identifies silent failures by monitoring secondary signals like response latency or payload size. Even if an API returns a 200 OK status, a sudden drop in response size or a shift in processing time can indicate a logic error. This is a core part of ML-Powered Anomaly Detection That Catches Trouble Before a Hard Failure.
Will anomaly detection increase my monitoring costs significantly?
Monitoring costs vary by provider, but they don't have to be prohibitive. StatusPulse avoids the "enterprise tax" by offering flat, transparent pricing that includes ML features. This prevents the cost spikes often associated with per-subscriber fees or high-cardinality data ingestion common in larger, more complex observability platforms that target enterprise-only budgets.
How do I handle false positives generated by machine learning models?
False positives are managed through human feedback loops. When a model flags a deviation that is actually normal behavior, you can reject the anomaly to retrain the model. This iterative process improves precision over time. It ensures the system learns the unique quirks of your microservices without requiring constant manual tuning of static rules.
Is ML-powered monitoring compliant with GDPR and data sovereignty rules?
Compliance depends on where your data is processed and stored. StatusPulse supports data sovereignty by allowing you to choose between EU and US hosting. This ensures your monitoring telemetry remains within your preferred jurisdiction. It helps you meet regional standards like GDPR while maintaining the high-performance monitoring required for modern SaaS applications.
Do I need a data scientist to set up ML-powered monitoring?
You don't need a data scientist to implement these tools. Modern platforms automate the selection and configuration of ML models for your specific metrics. The focus remains on your Golden Signals like latency and error rates. The underlying algorithms handle the complex math of time-series decomposition and baseline prediction without requiring manual intervention.


