

Why does your internal dashboard show all green when your users are reporting a total system outage? It’s a common frustration in distributed systems. Internal health checks often miss the "grey failures" that occur when networking issues or dependency timeouts break the user journey. Effective microservices uptime monitoring requires looking past individual container status to validate the entire request path.
Reliable monitoring for distributed architectures balances internal observability with external synthetic checks to ensure that what you see matches what the user experiences. This dual approach allows teams to identify failures in the network or authentication layer that internal metrics often overlook.
You already know that cascading failures make root cause analysis difficult and that enterprise-grade tools often come with bloated pricing models that don't scale. This guide will show you how to build a lean, effective monitoring strategy. We’ll explore how to set up external uptime checks, reduce your mean time to acknowledge (MTTA), and maintain transparent status communication without the corporate overhead.
Key Takeaways
- Learn how microservices uptime monitoring uses external synthetic probes to validate the full request path beyond simple container health.
- Balance internal observability with external black-box checks to detect "grey failures" that internal metrics frequently miss.
- Understand the "N+1" problem to prevent single-service disruptions from cascading through your entire distributed architecture.
- Reduce support tickets and alert fatigue by automating public status pages that provide transparent health updates to stakeholders.
- Simplify your technical stack by consolidating API, SSL, and uptime monitoring into a single, straightforward dashboard.
The Distributed Failure Surface: Why Microservices Require Different Uptime Monitoring
In a traditional monolith, uptime is binary. The server is either responding or it isn't. When you move to a microservice architecture, the failure surface expands significantly. Microservices uptime monitoring shifts the focus from hardware status to the external validation of distributed service endpoints. It's no longer enough to know if a virtual machine is running. You need to know if the specific service it hosts is fulfilling its contract with the rest of the system.
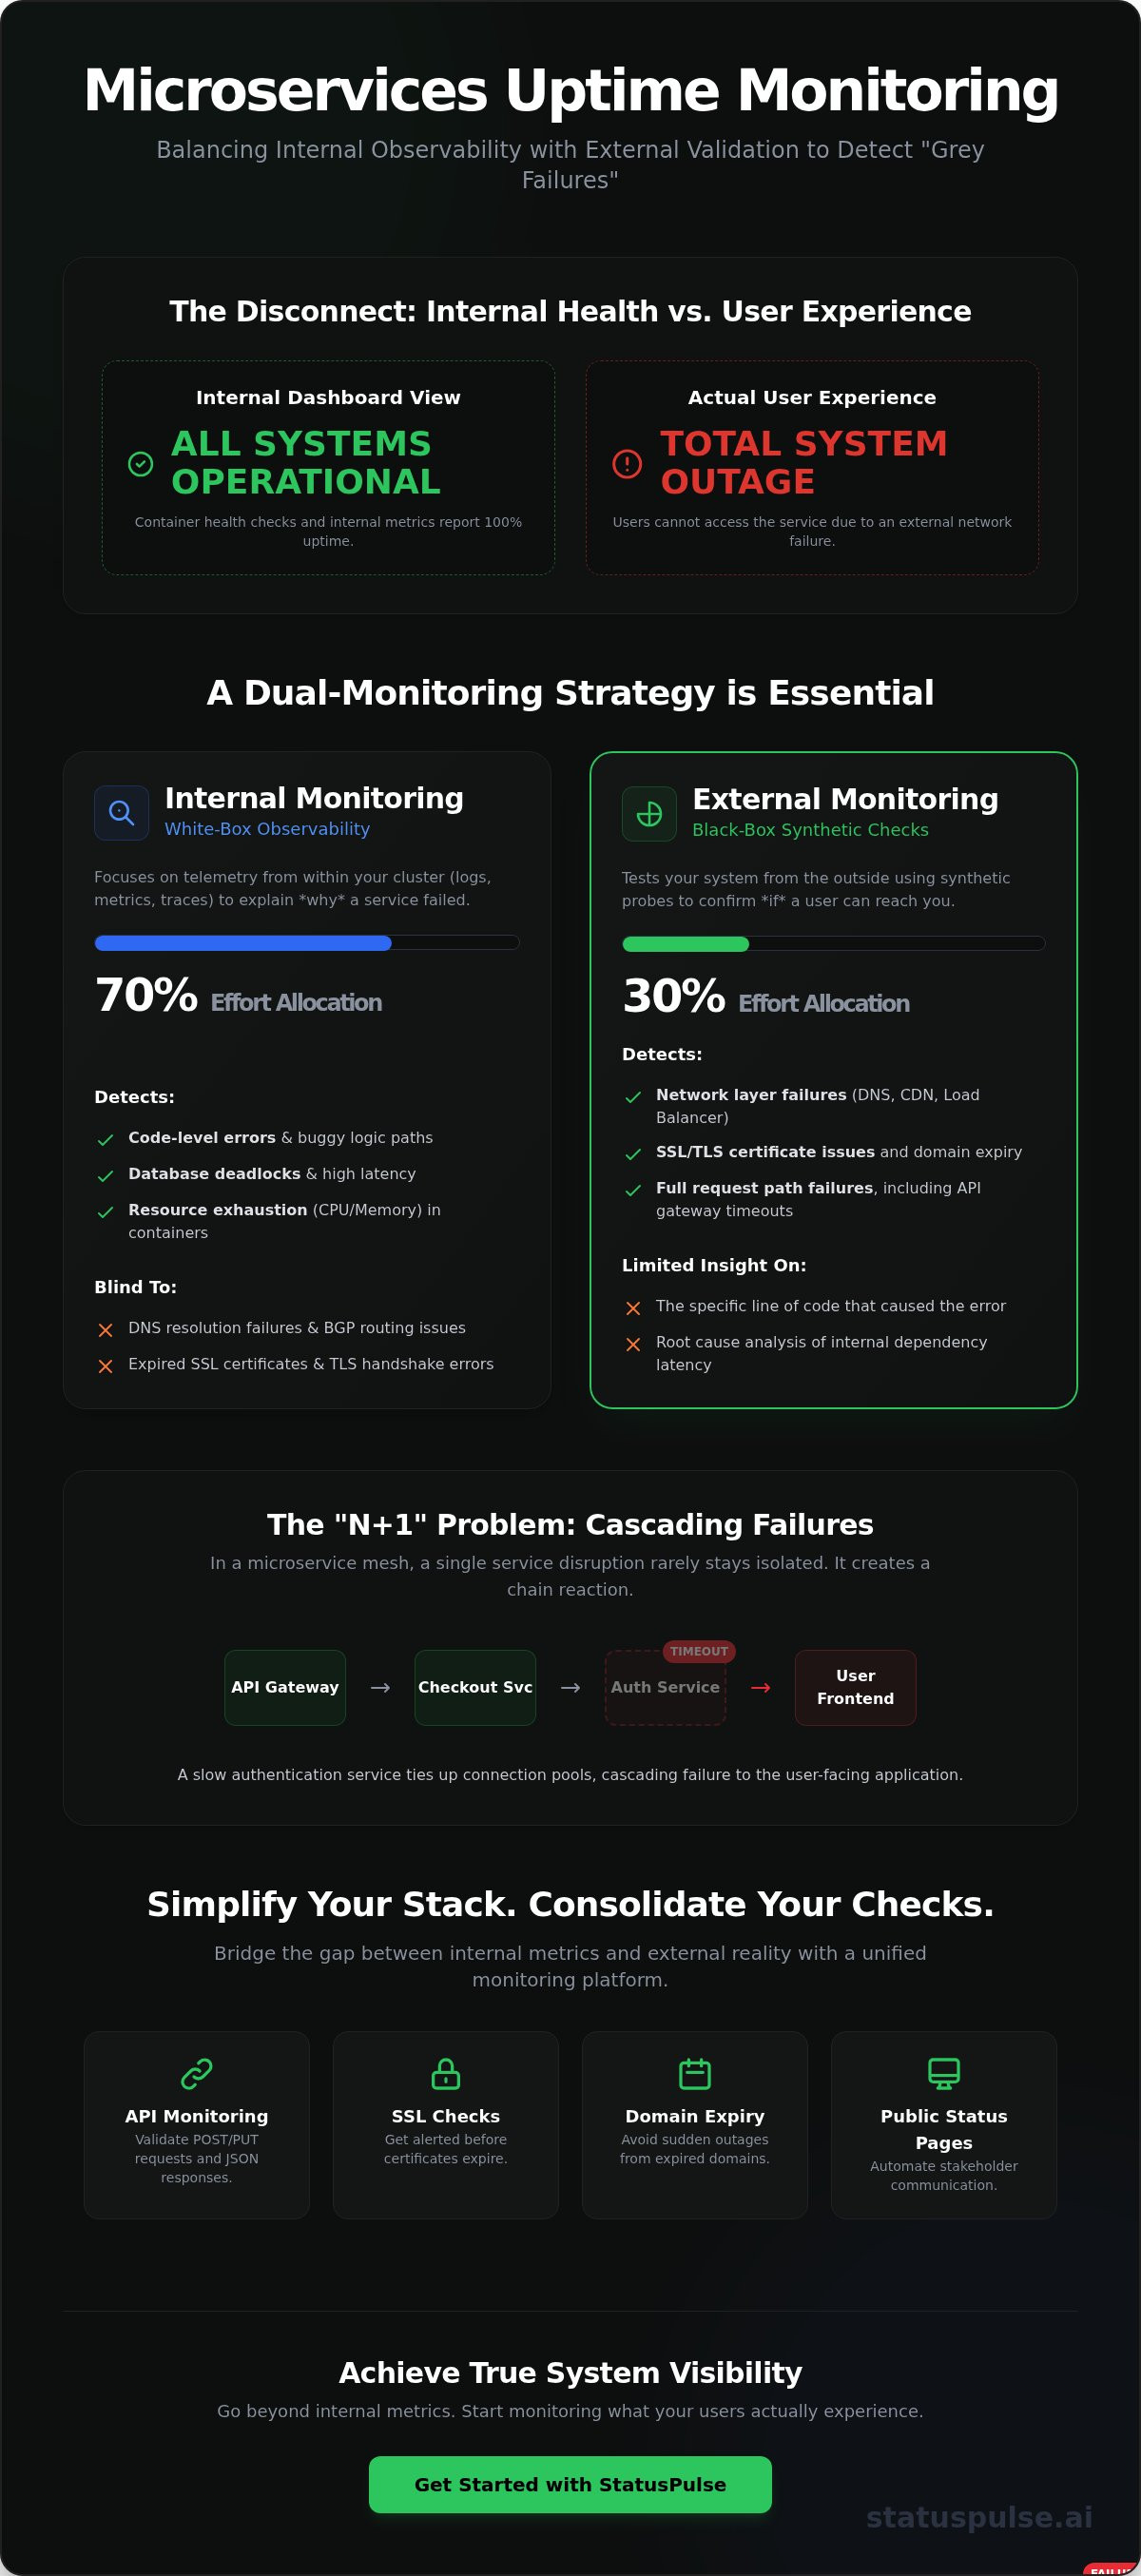
The "N+1" problem is the primary challenge in this environment. In a distributed mesh, a single service failure rarely stays isolated. It cascades. A slow authentication service can tie up connection pools in the API Gateway, eventually bringing down the entire user-facing frontend. This makes the primary goal of your monitoring strategy clear: you must verify that your edge services and API Gateways remain reachable and functional under real-world conditions.
Cascading Failures and Dependency Mapping
Upstream service latency often acts as a silent killer. If your payment service takes 500ms longer than usual, your checkout service might hit a timeout. These dependencies create a web of risk. Monitoring the entry point of your architecture is essential because it's what your customers actually see. Simple ICMP ping tests are insufficient. They can't tell you if a complex business logic path is failing due to a database deadlock or a broken third-party integration.
The Shift from Binary Uptime to Service Health
Microservices introduce the "degraded" state. This is a scenario where your search function works, but your recommendation engine is down. The system isn't "down" in the classic sense, but the user experience is compromised. Monitoring specific API endpoints provides more value than server-level checks. By focusing on user-centric availability metrics, you move away from vanity stats and toward a truthful representation of system health. Consolidating these checks into a platform like StatusPulse helps bridge the gap between internal metrics and external reality.
External vs. Internal Monitoring: Balancing Synthetic Checks with Observability
Internal monitoring, or white-box monitoring, focuses on telemetry from within your cluster. It relies on logs, performance metrics, and distributed traces to show how code executes. External monitoring, or black-box monitoring, tests your system from the outside. It uses synthetic probes to hit public APIs as a user would. For comprehensive microservices uptime monitoring, aim for a 70/30 split. Focus 70% of your effort on deep observability and 30% on external availability checks.
Internal tools excel at explaining why a service failed. They struggle to confirm if a user can actually reach you. A pod might be healthy while a networking layer failure blocks all traffic. Balancing these methods ensures that your dashboard reflects the true user experience. It brings honesty to your technical reporting and reduces the stress of troubleshooting invisible outages.
Why Internal Metrics Are Not Enough
Internal agents are blind to the infrastructure between your load balancer and the client's device. A service can be running perfectly while an expired SSL certificate or a DNS misconfiguration prevents all connections. These issues happen outside your cluster. Multi-region checks are the only way to detect localized outages. A routing failure in London won't show up in your US-East logs. You can explore these regional challenges in our guide to API Monitoring: The Developer’s Guide to High Availability in 2026.
Implementing Synthetic API Probes
Synthetic probes should do more than check for a heartbeat. Monitor POST and PUT requests with specific payloads to verify that your write paths are functional. A 200 OK status is the bare minimum. Your checks must validate the JSON response content to ensure the data is accurate and complete. This prevents "silent" failures where a service returns a success code but an empty body. Integrating a domain expiry checker helps you avoid the sudden outages that internal telemetry ignores. Using StatusPulse to manage these external validations keeps your microservices uptime monitoring simple and effective.
Building a Lean Microservices Monitoring Stack
Enterprise monitoring often suffers from a "more is better" fallacy. You don't need a thousand features if you only use ten. A lean microservices uptime monitoring stack focuses on precision over volume. It prioritizes the signals that actually impact your users. This approach avoids the corporate bloat typical of legacy providers. It also respects your budget with flat, transparent pricing. By stripping away unnecessary complexity, you gain a clearer view of your system's actual health.
Core Components of the Stack
A modern stack requires four specific tools to be effective. First, an Uptime Monitor. This provides global synthetic checks every 60 seconds. This frequency is a standard benchmark for production services. It catches intermittent failures that longer intervals miss. Second, an API Monitor. This goes deeper than a simple ping. It validates specific endpoints and monitors response times for latency spikes. Third, a Public Status Page. This serves as a dedicated hub for incident communication. It keeps stakeholders informed without manual intervention. Finally, an AI Incident Manager. This tool acts as an assistant by drafting technical updates during a crisis. It requires a final human action to publish, ensuring accuracy while saving time.
Selecting Tools Based on Ethics and Performance
Ethics in software matter as much as performance. Many incumbents use per-subscriber fees. These models penalize you as your user base grows. It’s a predatory tactic that makes scaling unnecessarily expensive. Look for tools that offer flat pricing regardless of how many people view your status page. Data sovereignty is another critical factor. You should have a clear choice between EU and US hosting. This allows you to meet specific regulatory requirements or data residency laws. Verify GDPR compliance by checking where the data actually resides and how it’s processed.
Choosing the right tool depends on your team's size and technical needs. You can find a detailed breakdown of website uptime monitoring tools for different team scales on our blog. For those who value simplicity, StatusPulse provides an all-in-one platform. It combines monitoring, status pages, and AI-assisted incident management. It avoids the complexity of enterprise software. It's built for specialists who want straightforward, reliable results.
Solving the Communication Gap: Translating Service Health into User Trust
Microservice architectures generate a high volume of telemetry. This often leads to alert fatigue, where critical signals get buried in noise. While your team performs root cause analysis, your users are left guessing. Effective microservices uptime monitoring must bridge this gap. You need to translate technical service health into a language your customers actually understand.
A public status page is the most effective way to manage this. It provides a single source of truth for stakeholders. Don't hide behind vague maintenance banners. Honesty regarding incident updates builds long-term integrity. When you acknowledge a failure early, you prove you are in control of the situation. This proactive approach reduces support tickets and calms user anxiety.
Automating Incident Communication with AI
Writing status updates during a high-pressure outage is stressful. AI can help by summarizing technical logs into clear, non-technical language. This allows your engineers to focus on the fix while your communication remains professional. Human agency is still vital. Use AI as an assistant that requires a final human verification before any update goes live. This ensures accuracy while maintaining a fast response rhythm for your microservices uptime monitoring strategy. To further protect your systems as you adopt these technologies, you can explore Managed extended Detection and Response (MXDR) for advanced threat protection.
Component-Based Status Reporting
Your customers don't care about your service mesh topology or container names. Map your internal services to functional categories like "Payments," "User Dashboard," or "Search." This allows you to report partial outages without causing unnecessary alarm. If one service is degraded but core features work, your status page should reflect that nuance. StatusPulse allows you to group multiple microservices into distinct components on a single page, keeping your incident transparency as streamlined as your architecture.
Implementing StatusPulse for Microservice Resilience
Effective microservices uptime monitoring shouldn't require a six-month enterprise rollout. It should be a matter of minutes. By consolidating your external checks into a single dashboard, you eliminate the fragmentation that leads to missed alerts. This unified view ensures that you catch issues before they escalate into global outages. You can manage API health, SSL certificates, and public communication from one place.
Setting up 1-minute checks is the baseline for high-availability services. This frequency provides the granularity needed to detect intermittent failures in your service mesh. You can integrate these checks with your existing incident response workflow to ensure a controlled reaction to every disruption. It's about having the right data at the right time.
Quick Setup: From Zero to Monitored
Adding a new API endpoint for synthetic monitoring is straightforward. You define the target URL, select the probe regions, and set your validation criteria. Configuring alert thresholds is a vital step to avoid false positives. You should set rules that require multiple consecutive failures from different regions before triggering an alert. This prevents noise from temporary network blips. Once your monitors are active, creating a public status page is a brief task. You can map your services to components immediately, providing the transparency your users expect.
The StatusPulse Value Proposition
Legacy monitoring tools often hide their true cost behind complex per-user or per-subscriber fees. This model creates a financial penalty for companies that want to keep their stakeholders informed. We use a flat pricing model. You pay for the monitoring you use, not the number of people who view your status page. This ethical approach ensures that your costs remain predictable as your system scales.
Data sovereignty is a core virtue of the platform. You have the choice between EU and US hosting to meet your specific regional requirements. For European teams, EU-based hosting simplifies compliance by ensuring data stays within the jurisdiction. It's a principled choice for specialists who value privacy and precision. If you are ready to move beyond the complexity of enterprise incumbents, you can monitor your microservices stack with StatusPulse today.
Achieving Distributed Reliability Through Precision
Reliability in a distributed system isn't an accident. It's the result of a deliberate strategy that balances internal observability with external synthetic validation. You've seen how dependency cascades can hide behind internal metrics. By implementing microservices uptime monitoring that mirrors the user journey, you eliminate the blind spots created by network and DNS failures.
Transparency is your most powerful tool for maintaining user trust during an outage. Consolidating your monitoring and status updates into a single, honest platform reduces technical debt and alert fatigue. StatusPulse offers a principled alternative to enterprise bloat with flat pricing and no per-subscriber fees. You can choose between EU and US hosting to maintain data sovereignty while utilizing AI-powered incident management to streamline your communication.
Stop fighting complex pricing models and fragmented tools. Focus on building resilient services while we handle the validation. Start monitoring your microservices stack with StatusPulse and gain the quiet confidence that comes with true system visibility.
Frequently Asked Questions
What is the difference between microservices monitoring and monolithic monitoring?
Monolithic monitoring treats the application as a single unit with a binary up or down status. Microservices require you to monitor the communication between dozens of moving parts. It's the difference between checking a pulse and mapping an entire nervous system. You must track how individual service failures impact the broader system mesh.
How often should I run synthetic uptime checks on my microservices?
Run checks every 60 seconds for critical production endpoints. This frequency catches transient network issues and grey failures that 5-minute intervals often miss. It provides the granularity needed for high-availability targets. Faster intervals like 30 seconds are useful for high-traffic authentication or payment services.
Can I monitor microservices that are not public-facing?
External synthetic tools typically monitor public-facing endpoints or API Gateways. If your services are strictly internal, you'll need a probe within your VPC. However, monitoring the public entry points is what defines microservices uptime monitoring for user reliability. It validates the path your customers actually take.
How do I avoid alert fatigue in a microservices architecture?
Set intelligent thresholds rather than alerting on every single failed ping. Require three consecutive failures from at least two different geographic regions before notifying the team. This filter stops noise from localized network blips. It ensures that when your phone rings, the issue is real and requires immediate human action.
Is it better to monitor individual services or the API Gateway?
Start with the API Gateway as it represents the user's entry point. If the Gateway is down, the entire system is effectively unreachable for the customer. Once the edge is covered, add monitors for critical downstream services like payments or search. This layered approach ensures you see what the user sees first.
Why is EU hosting important for microservices monitoring?
EU hosting ensures your monitoring data stays within European jurisdiction. This is a core requirement for teams prioritizing data sovereignty and strict GDPR compliance. It avoids the legal complexity of cross-border data transfers to US-only providers. Choosing a provider with regional hosting options respects local privacy standards.
How does AI help in microservices incident management?
AI acts as a technical assistant during a high-pressure outage. It can ingest complex error logs and draft a clear summary for your stakeholders. A human always makes the final call to publish the update. This saves time and ensures consistent communication when your engineering team is focused on the fix.
What are the most critical KPIs for microservices uptime?
Focus on P95 latency and error rates. A service is only functional if it responds within your SLO, such as 500ms for user-facing requests. High error rates on a 200 OK response also count as downtime in a distributed environment. Track these alongside mean time to acknowledge (MTTA) to measure your response efficiency.


