
Most engineering teams spend more time justifying their uptime than actually maintaining it. Manual report generation is a silent productivity killer. It forces senior developers to scrape data from disparate dashboards just to prove they're meeting SLAs. If your stakeholders are ignoring complex monitoring tools, it's because they want answers, not raw data. Implementing Scheduled PDF Reports with 14 Sections and 4 Cadences Delivered to Your Inbox ensures that technical health metrics reach the right eyes without manual intervention.
We agree that transparency shouldn't come at the cost of your focus. You need a reporting architecture that bridges the gap between granular API health and executive level summaries. This guide shows you how to architect a comprehensive uptime report that maintains stakeholder trust and engineering transparency. We'll examine the 14 critical data sections every report needs and how to select the right delivery frequency to prevent missed SLA breaches while keeping your inbox clean. You'll learn to build a single source of truth for uptime, SSL, and API health that requires zero manual effort.
Key Takeaways
- Overcome dashboard fatigue by delivering critical technical audits directly to stakeholder inboxes, ensuring visibility without requiring manual logins.
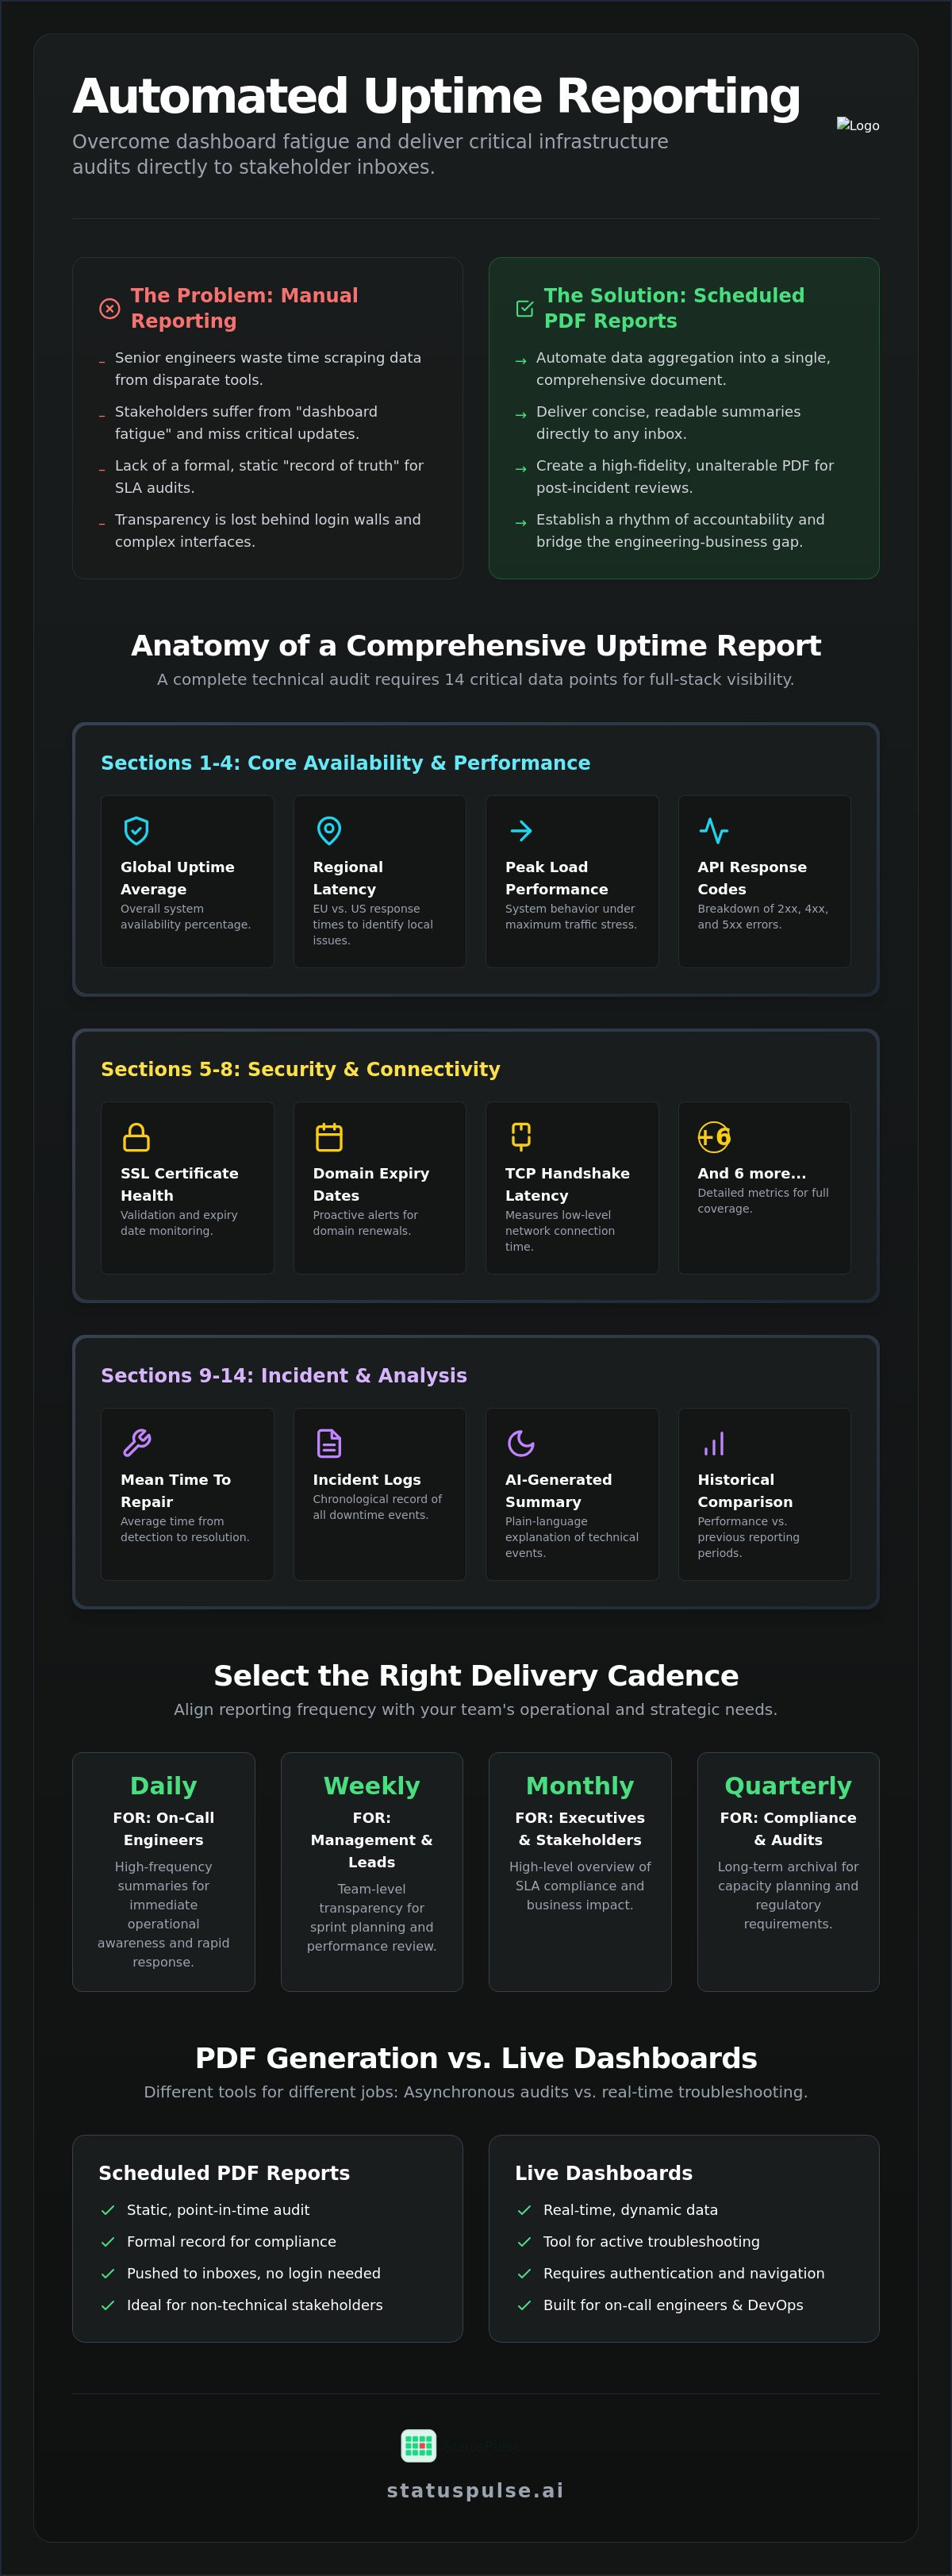
- Implement Scheduled PDF Reports with 14 Sections and 4 Cadences Delivered to Your Inbox to provide a comprehensive view of global uptime, regional latency, and SSL health.
- Align your reporting frequency with operational needs, utilizing daily summaries for on-call engineers and weekly cadences for management-level transparency.
- Establish a reliable "record of truth" for post-incident reviews and SLA audits by utilizing high-fidelity PDFs that capture system state better than dynamic dashboards.
- Reclaim engineering time by automating the generation of complex technical health metrics into concise, readable summaries.
The Role of Scheduled Reports in High-Availability Infrastructure
Scheduled PDF reports are asynchronous technical audits. They aren't just snapshots of a dashboard. They represent a formal record of system performance over a specific window. In a high-availability infrastructure, real-time monitors are essential for the on-call engineer. However, they often fail the wider organization due to dashboard fatigue. Stakeholders rarely have the time to log into a monitoring suite to check a status. When the login barrier exists, transparency dies.
Inbox delivery solves this by pushing data to the decision-maker. It removes the friction of authentication and navigation. While live observability tools are built for active troubleshooting, static reports serve a different purpose. They provide a point-in-time audit that can't be altered or misinterpreted by changing live filters. Implementing Scheduled PDF Reports with 14 Sections and 4 Cadences Delivered to Your Inbox creates a rhythm of accountability that live dashboards can't replicate.
Bridging the Gap Between Engineering and Business
Raw uptime data often lacks context for non-technical leadership. Automated reports translate these numbers into business-friendly SLA metrics. This conversion is vital for maintaining trust during quiet periods and providing clarity during outages. Archival PDFs also serve as a critical asset for long-term compliance and regulatory audits. They provide a paper trail that proves you met your obligations. By proactively sharing these summaries, you reduce support overhead. Internal teams don't need to ask for updates when the data is already in their inbox.
Data Sovereignty and Reporting Security
For many organizations, where their data lives is as important as what the data says. EU-based hosting is a non-negotiable requirement for teams handling sensitive endpoint information. Relying on third-party scrapers to generate reports introduces unnecessary security vectors. A native reporting engine, like the one built into StatusPulse, keeps your data within your chosen jurisdiction. These reports must be delivered via secure, encrypted SMTP channels to ensure that your infrastructure's health metrics don't become a vulnerability. This approach prioritizes integrity over convenience.
Defining the 14 Critical Sections of an Uptime PDF Report
A comprehensive technical audit requires more than a simple uptime percentage. To maintain full-stack visibility, a 14-section framework is necessary to cover everything from low-level handshake latency to high-level SLA compliance. This structure ensures that no part of the infrastructure remains a black box. When you implement Scheduled PDF Reports with 14 Sections and 4 Cadences Delivered to Your Inbox, you're building a document that serves both the on-call engineer and the CTO.
The first four sections focus on Core Availability. This includes global uptime averages, regional latency breakdowns, and peak load performance. Sections five through eight pivot to Security and Connectivity. Here, the report must detail SSL certificate health, domain expiry dates, API response codes, and TCP handshake latency. These metrics often signal a brewing crisis before a total outage occurs. Monitoring these specific data points allows teams to catch misconfigurations in staging or production environments early.
The final sections, nine through fourteen, provide Incident and Analysis context. This involves tracking Mean Time to Repair (MTTR), reviewing incident logs, and utilizing AI-generated summaries for clarity. Historical comparisons and specific infrastructure recommendations round out the report. By grouping data this way, the report moves from raw numbers to actionable intelligence. It transforms a list of pings into a strategic document for capacity planning.
Core Availability and Performance Indicators
Separating EU and US latency data is non-negotiable for modern distributed systems. Network paths and peering agreements differ significantly between regions; an aggregate score hides localized failures. Measuring peak load performance is equally critical. It identifies resource bottlenecks that only appear during traffic spikes. Mean Time to Repair (MTTR) acts as the ultimate efficiency metric for DevOps by quantifying the average duration from incident detection to resolution. These indicators help engineers prioritize which regions or services require architectural refactoring.
Incident Context and AI Intelligence
Raw logs are difficult for stakeholders to parse during a post-mortem. AI Incident Management plays a vital role here by drafting human-readable summaries that explain the "why" behind a failure. When designing Engineering Inbox-Ready Reports, it's vital to distinguish between exploratory dashboards and declarative audits. A historical month-over-month comparison is required for accurate capacity planning and identifying "flapping" services. Finally, the report should offer concrete recommendations. This turns monitoring data into a roadmap for infrastructure upgrades. You can automate this entire 14-section framework natively using StatusPulse to ensure your team stays ahead of SLA breaches.
Selecting the 4 Delivery Cadences for Technical and Business Alignment
Effective reporting isn't about data volume. It's about timing. A report sent too frequently becomes background noise; one sent too late misses a critical SLA breach. You need a tiered approach to visibility. Implementing Scheduled PDF Reports with 14 Sections and 4 Cadences Delivered to Your Inbox allows you to match technical granularity with the appropriate business rhythm. This structure ensures that every stakeholder receives actionable data at the exact moment they need it.
The first tier is the Daily Cadence. Often called the "Morning Coffee" report, it's designed for SREs and on-call engineers. It provides a concise summary of the last 24 hours. The focus is on immediate operational awareness and identifying minor regressions before they escalate. The Weekly Cadence shifts the perspective toward the team sync. This report is vital for identifying recurring patterns or "flapping" monitors that might be missed in daily alerts. It helps teams prioritize their weekly sprint tasks based on actual infrastructure performance.
The Monthly Cadence serves as the official SLA compliance record. This document is for management and external stakeholders who need to verify that uptime guarantees were met. Finally, the Quarterly Cadence facilitates strategic reviews. CTOs use this to evaluate infrastructure ROI and long-term stability. It provides the high-level perspective needed to justify architectural changes or budget increases for the coming months.
Operational vs. Strategic Reporting
Not all 14 sections are relevant for every cadence. A daily report should emphasize regional latency and recent incident logs. Conversely, a monthly summary focuses on MTTR and historical comparisons to track growth. This alignment follows frameworks like NIST SP 800-137, which establishes the importance of continuous monitoring and periodic review. Optimizing these cadences prevents "Inbox Noise." It ensures that your engineers aren't overwhelmed by data they can't act on immediately. You can even automate cadence shifts based on incident severity or when a service nears an SLA threshold.
Stakeholder Mapping for Cadences
Mapping the right report to the right person is critical for organizational transparency. Weekly reports are best suited for Product Owners and Lead Developers. They need to understand how system health impacts the user experience. Quarterly reports must be board-ready. This means focusing on stability and efficiency rather than technical jargon. Providing opt-in flexibility for different cadences ensures that data remains relevant to each recipient's specific role. This approach builds a culture of accountability without adding to the team's cognitive load.
Engineering Inbox-Ready Reports: PDF Generation vs. Live Dashboards
Dashboards are dynamic by design. This is a strength for real-time debugging but a weakness for historical accountability. A live view changes as data ages or retention policies kick in. PDF reports provide a frozen state. They act as a durable record of truth for post-incident reviews. When you need to prove SLA compliance from six months ago, a static document is your best evidence. Real-time observability is for the "now," while PDF reports are for the "record."
The technical challenge lies in high-fidelity generation. Converting complex monitoring data into a portable format requires precision. It's not just about layout. It's about ensuring stakeholders on the go can read them. Mobile responsiveness is critical because many executives check reports on their phones during transit. Implementing Scheduled PDF Reports with 14 Sections and 4 Cadences Delivered to Your Inbox ensures that your data remains accessible and professional across all devices.
The Anatomy of a High-Fidelity PDF Report
Visualizing uptime effectively requires more than raw tables. Sparklines and heatmaps provide immediate context in an email. They show trends without cluttering the page. Formatting matters. You must optimize file size while maintaining data granularity. Native PDF generation is superior to automated browser screenshots because it preserves text searchability and vector clarity. This ensures that your reports look sharp even when printed for board meetings.
Data Integrity and Point-in-Time Accuracy
Preventing "Data Drift" is a common hurdle for engineering teams. The report data must perfectly match your status page history. Discrepancies destroy trust with stakeholders. Time zone alignment is another technical trap. Reporting in UTC is standard for engineering, but local time often works better for regional business units. You must ensure your reporting engine handles these offsets correctly to avoid reporting outages on the wrong day.
Contextualizing uptime is where human agency meets automation. Adding human-written notes alongside automated metrics explains the "why" behind the numbers. This combination turns a technical audit into a clear narrative for non-technical readers. You can automate your technical reporting with native PDF generation to ensure these narratives are delivered consistently. This approach prioritizes transparency while respecting the time of your engineering team.
Streamlining Reporting Workflows with StatusPulse
StatusPulse automates the architectural heavy lifting of technical reporting. Instead of building custom scripts to scrape dashboards, you can configure Scheduled PDF Reports with 14 Sections and 4 Cadences Delivered to Your Inbox directly from the platform interface. The system handles the aggregation of core availability metrics and security data without manual intervention. This native approach ensures that the record of truth is generated with technical precision every time.
Configuration is logical. You select the probes and monitors you want to include, choose your cadences, and define your recipient list. The 4-cadence system ensures that SREs get their daily operational data while leadership receives monthly SLA summaries. This tiered visibility prevents inbox clutter. It ensures that data delivery remains a tool for clarity rather than a source of cognitive load for your team.
AI Incident Management bridges the gap between raw data and human understanding. It automatically drafts summaries for every incident log included in your report. This removes the burden of manual post-mortem writing for every weekly or monthly summary. By using AI as a technical assistant, you maintain high-fidelity reporting even during high-velocity development cycles. It ensures that non-technical stakeholders understand the resolution steps taken during an outage.
Data sovereignty remains a core virtue of the platform. You can choose between EU or US hosting for your monitoring data and reporting engine. This choice is critical for teams navigating strict GDPR requirements or regional privacy standards. It ensures that your infrastructure health data remains within your required jurisdiction. You don't have to compromise on compliance to get high-quality reporting.
Native Monitoring and Reporting Integration
Consolidating uptime monitoring and API monitoring into a single PDF eliminates the need for fragmented reporting tools. StatusPulse treats these as part of a unified stack. Unlike legacy competitors that charge success taxes via per-subscriber fees, StatusPulse offers flat, transparent pricing. You can scale your reporting to unlimited stakeholders without increasing your monthly cost. Setting up your first scheduled report takes under five minutes.
Transparency as a Competitive Advantage
Automated reports are more than just technical audits. They are instruments of trust. By consistently delivering health metrics to your customer base or internal stakeholders, you demonstrate a commitment to integrity. This proactive approach helps you show, don't claim, your 99.9% uptime. It replaces vague marketing promises with concrete, verifiable data that stakeholders can rely on. Start building transparent reports with StatusPulse to reclaim your engineering time and maintain stakeholder confidence.
Building a Culture of Infrastructure Accountability
Effective uptime management requires more than just reactive alerts. It demands a structured record of performance that stakeholders actually read and understand. By moving from dynamic dashboards to static, asynchronous audits, you establish a reliable source of truth for every SLA review and post-mortem. Implementing Scheduled PDF Reports with 14 Sections and 4 Cadences Delivered to Your Inbox ensures that your team stays focused on engineering while the reporting engine handles the transparency. This approach bridges the gap between deep technical metrics and high-level business goals.
You shouldn't have to choose between technical granularity and operational simplicity. StatusPulse offers a streamlined path to automated reporting with native AI Incident Management summaries and the choice of EU or US hosting for full data sovereignty. You get professional, high-fidelity audits without the burden of complex pricing models or hidden per-subscriber fees. It's an ethical, straightforward solution for teams that value precision. Reclaim your engineering hours and build long-term trust through consistent, high-quality data delivery that arrives exactly when it's needed.
Automate your technical reporting with StatusPulse and start proving your reliability with every email.
Frequently Asked Questions
Is it better to send reports as PDF or CSV?
PDF is the standard for technical audits because it preserves the visual integrity of sparklines and heatmaps. Stakeholders prefer a readable document that provides immediate context over a raw data dump. CSV is only useful if you intend to import the metrics into another tool for secondary analysis.
Can I include AI-generated summaries in my scheduled reports?
Yes, AI Incident Management can automatically populate your reports with human-readable summaries of downtime events. This feature explains the "why" behind an outage without requiring manual entry from your engineering team. It ensures that non-technical stakeholders understand the resolution steps taken during an incident.
How much does it cost to send reports to multiple stakeholders?
StatusPulse utilizes flat pricing with no per-subscriber fees. You can distribute Scheduled PDF Reports with 14 Sections and 4 Cadences Delivered to Your Inbox to your entire team or client base without increasing your monthly bill. This transparent model prevents the "success tax" often found in legacy monitoring tools.
What are the most important sections to include in a monthly SLA report?
A monthly SLA report must prioritize global uptime, regional latency, and Mean Time to Repair (MTTR). These sections provide the objective proof needed to verify that you met your contractual obligations. Including historical month-over-month comparisons helps identify long-term stability trends and capacity needs.
Can I schedule reports to be sent only when an incident occurs?
Scheduled reports are designed for periodic audits and transparency rather than immediate incident response. Real-time alerts handle the "now," while these reports provide a point-in-time record for accountability. You should use them to maintain a consistent rhythm of communication with your stakeholders regardless of system state.
How does EU hosting affect the delivery of my reports?
Choosing EU hosting ensures that your reporting data stays within European jurisdiction to comply with GDPR and local privacy standards. It supports data sovereignty by keeping sensitive endpoint information in the region you select. StatusPulse offers both EU and US hosting to give you full control over your data residency.
What happens if a report fails to deliver to an inbox?
The system tracks delivery logs so you can identify if a report was blocked by an email filter or an incorrect address. You can review your SMTP configuration within the platform to troubleshoot issues. This ensures that critical technical audits don't disappear without a trace during important reporting windows.
Can I customize the branding of the PDF reports for my clients?
You can customize your reports with your company logo and visual theme to maintain a professional appearance. This turns a technical audit into a white-labeled asset for your business. It's an effective way to "show, don't claim" your reliability while keeping your brand front and center for your customers.


