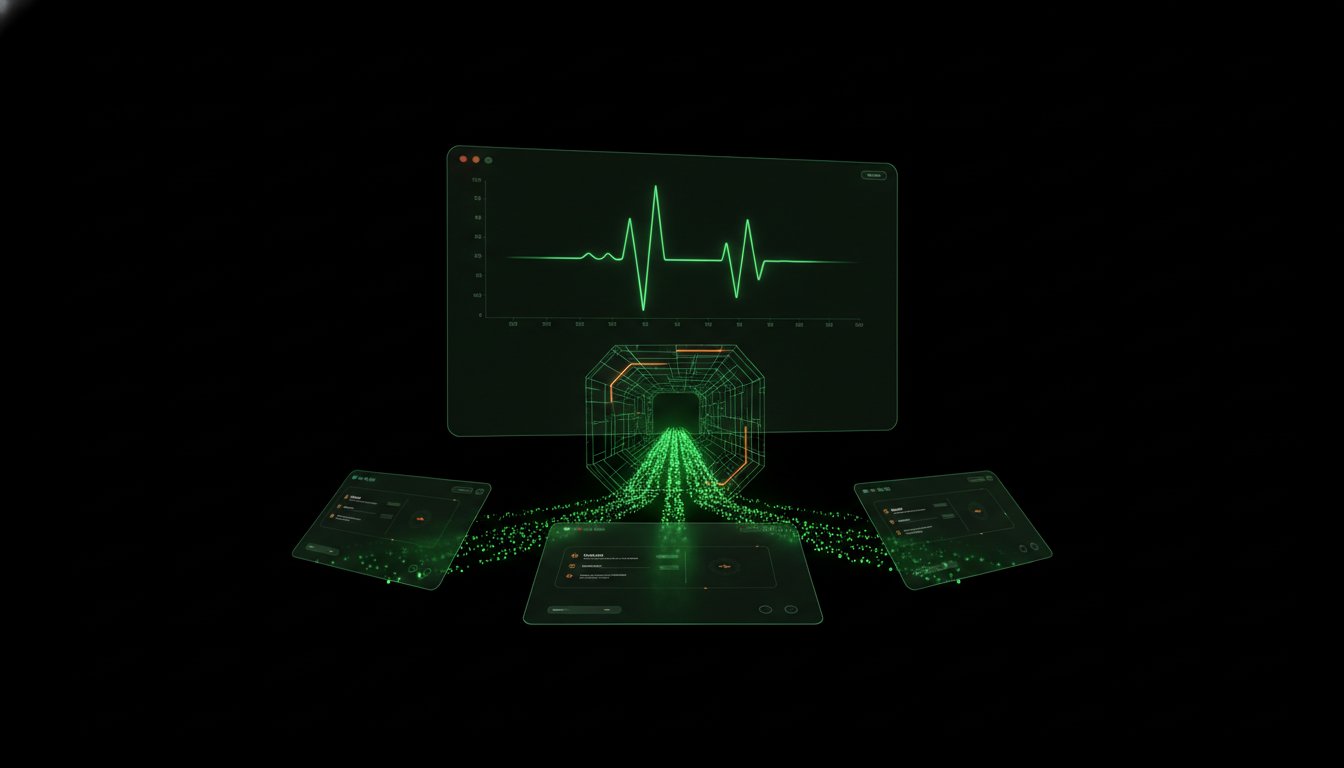
Why does a minor database lag often spiral into a PR disaster while a total outage handled with transparency barely makes a dent in customer trust? Incident management is frequently treated as a technical fire drill, but it is actually a communication problem masquerading as a code issue. You know the feeling of staring at a wall of monitoring alerts while your support inbox explodes with the same three questions. It is frustrating to juggle terminal windows and manual status page updates when every second of downtime costs money.
We agree that manual updates and alert fatigue should not be the norm for a professional engineering team. This guide provides a technical blueprint for An 8-Phase Incident Lifecycle from First Alert to Published Post-Mortem. You will learn how to move from chaotic, manual responses to a standardized workflow that lowers your Mean Time to Acknowledge (MTTA) and automates the tedious parts of communication. We will break down the transition from the first monitoring trigger through to the final public report, ensuring your team stays focused on the fix rather than the paperwork.
Key Takeaways
- Shift from reactive support tickets to proactive detection using 1-minute uptime checks. This ensures your team identifies failures before your customers do.
- Implement An 8-Phase Incident Lifecycle from First Alert to Published Post-Mortem to standardize your response. This framework reduces MTTA by removing guesswork during high-pressure disruptions.
- Isolate failure domains quickly to minimize the blast radius. Focus on technical mitigation like rolling back deployments while keeping stakeholders informed through automated status updates.
- Treat post-mortems as technical autopsies rather than blame-shifting exercises. Use cross-referenced logs and monitoring data to identify and fix systemic weaknesses.
- Prioritize transparency by moving internal reports to a public status page. Technically honest communication builds long-term trust and reduces the volume of support tickets during future incidents.
Defining the 8-Phase Incident Lifecycle
The incident lifecycle is the chronological sequence of actions taken to identify, mitigate, and learn from service failures. It is not just a technical fire drill. Instead, the incident lifecycle functions as a continuous feedback loop between system monitoring and user trust. While traditional incident management frameworks like NIST or SANS provide a solid foundation for security, they often lack the granular steps required for modern SaaS operations. These legacy models tend to ignore the nuances of public communication and the role of AI-driven analysis in high-velocity environments.
Adopting An 8-Phase Incident Lifecycle from First Alert to Published Post-Mortem provides your team with specific checkpoints for external transparency. It moves beyond simple "containment" to ensure that every disruption results in long-term prevention. By breaking the process into eight distinct stages, you eliminate the ambiguity that leads to missed alerts or forgotten post-mortems.
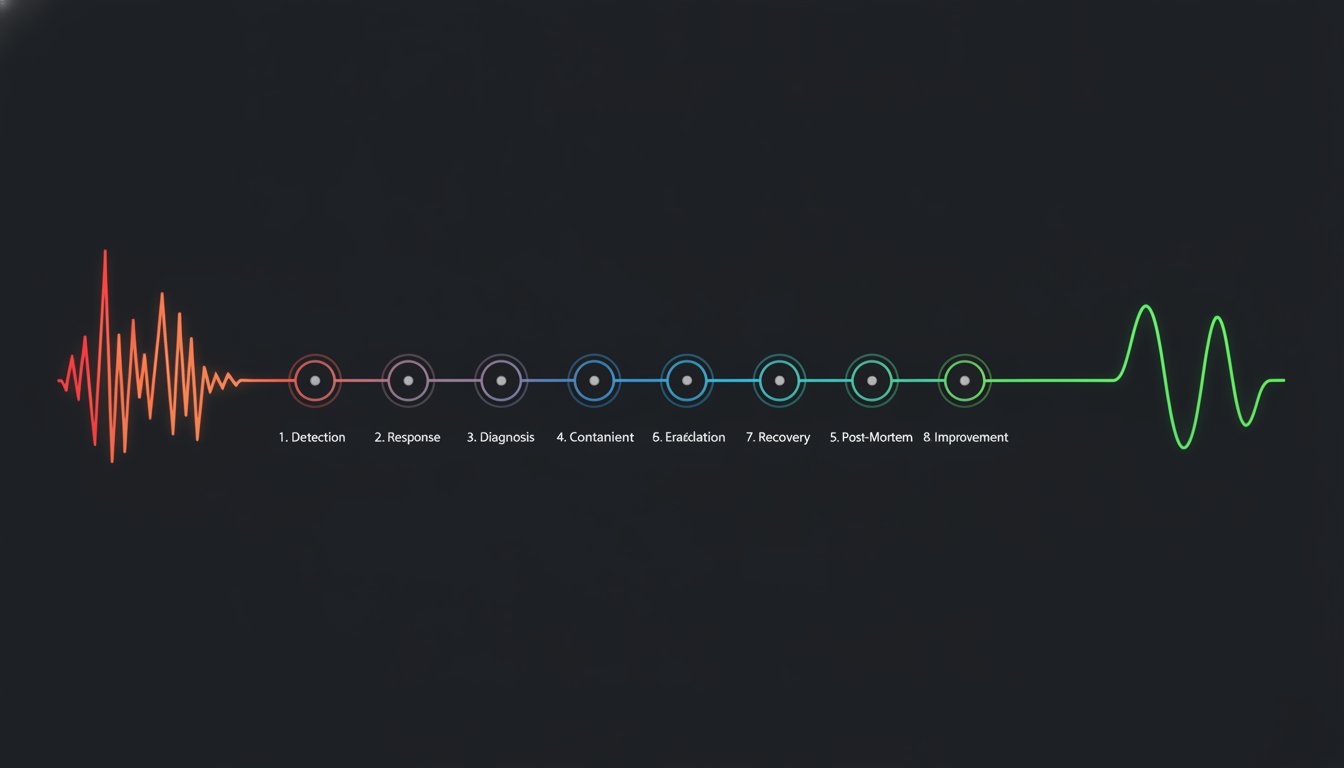
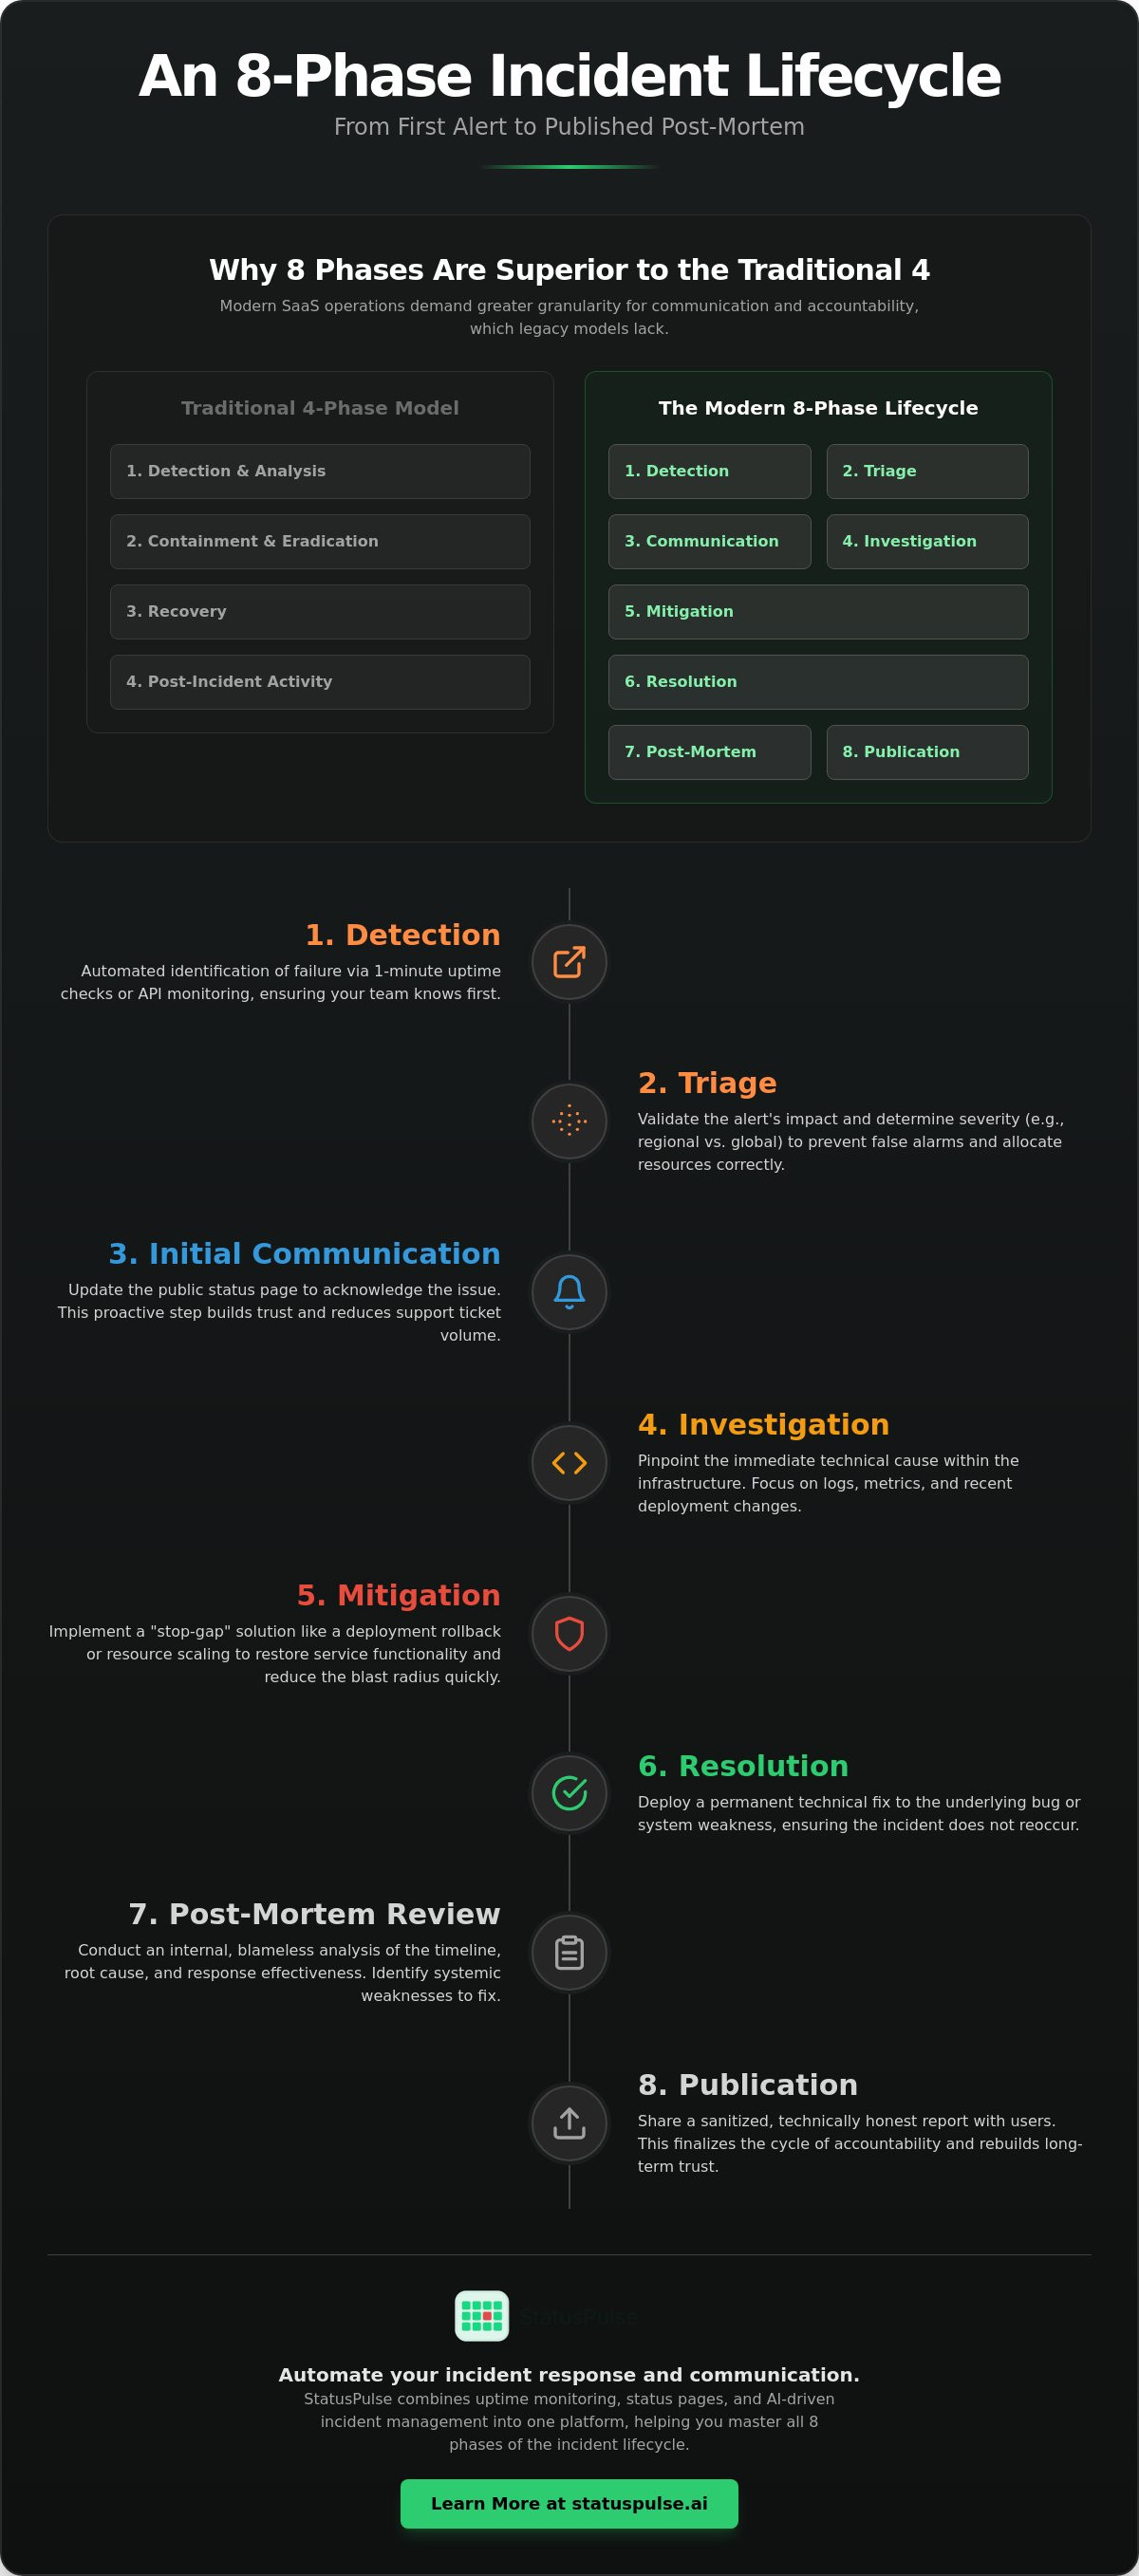
The 8 Phases at a Glance
- 1. Detection: Automated identification of the failure via uptime monitoring or API checks.
- 2. Triage: Validating the impact and determining the severity level.
- 3. Initial Communication: Updating the status page to acknowledge the issue to users.
- 4. Investigation: Finding the immediate technical cause within the infrastructure.
- 5. Mitigation: Implementing a "stop-gap" to restore service functionality quickly.
- 6. Resolution: Deploying a permanent technical fix to the underlying bug.
- 7. Post-Mortem Review: Internal analysis of the timeline, root cause, and response.
- 8. Publication: Sharing a sanitized, technical report with users to rebuild trust.
Why 8 Phases Instead of 4?
Most industry incumbents rely on a condensed four-phase model. This is often too broad for DevOps teams. SaaS users now expect real-time updates, which makes communication its own distinct phase rather than a side task. If you don't treat communication as a core step, your support team will be buried in tickets while your engineers are trying to code a fix.
Separating mitigation from resolution is equally critical. Mitigation is about reducing the blast radius. You might roll back a deployment or scale up a database cluster to stop the bleeding. This is different from resolution, where you address the actual logic error. Without this distinction, teams often suffer from "false closes" where the symptoms vanish but the bug remains to trigger another incident tomorrow. Finally, explicitly including publication ensures the learning process is never skipped. It forces the team to move the post-mortem from a private document to a public-facing asset, finalizing the cycle of accountability.
Phase 1-3: From Automated Detection to Public Alerting
The first three phases of An 8-Phase Incident Lifecycle from First Alert to Published Post-Mortem determine whether you control the narrative or the narrative controls you. If your first indicator of an outage is a surge in support tickets or a Twitter mention, your Mean Time to Detect (MTTD) is too high. Detection should happen via automated 1-minute uptime checks. This proactive approach ensures your team is the first to know, providing a critical head start before the "blast radius" reaches your user base.
The NIST Computer Security Incident Handling Guide emphasizes that effective detection requires high-quality data and analysis. In a modern infrastructure, this means moving beyond simple "up or down" checks. Once an alert triggers, you move into Phase 2: Triage. At this stage, you must quickly determine if the failure is a regional outage, a global service disruption, or a false positive from a single monitoring node. This validation prevents unnecessary panic and ensures that resources are allocated to real problems.
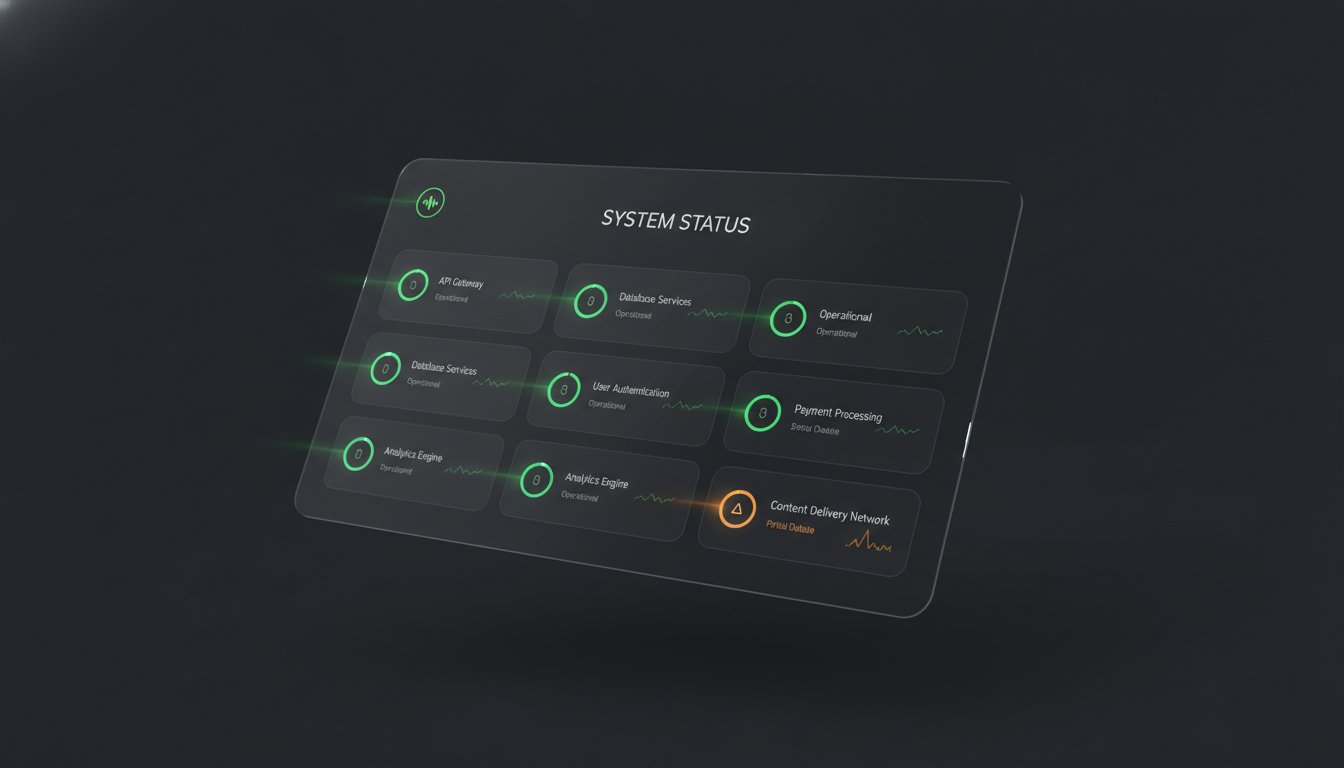
Optimizing Detection with Uptime Monitoring
Standard monitoring often misses the nuances of modern distributed systems. You should configure API monitoring to detect silent failures in backend services that might not trigger a standard HTTP 500 error. For example, an API might return a 200 OK status but deliver an empty JSON payload. Dedicated monitoring catches these logic failures. Additionally, using SSL certificate monitoring prevents the avoidable embarrassment of an expired cert taking down your entire frontend. Multi-region checks are also vital to differentiate between a local ISP routing issue and a genuine data center failure.
The 5-Minute Communication Goal
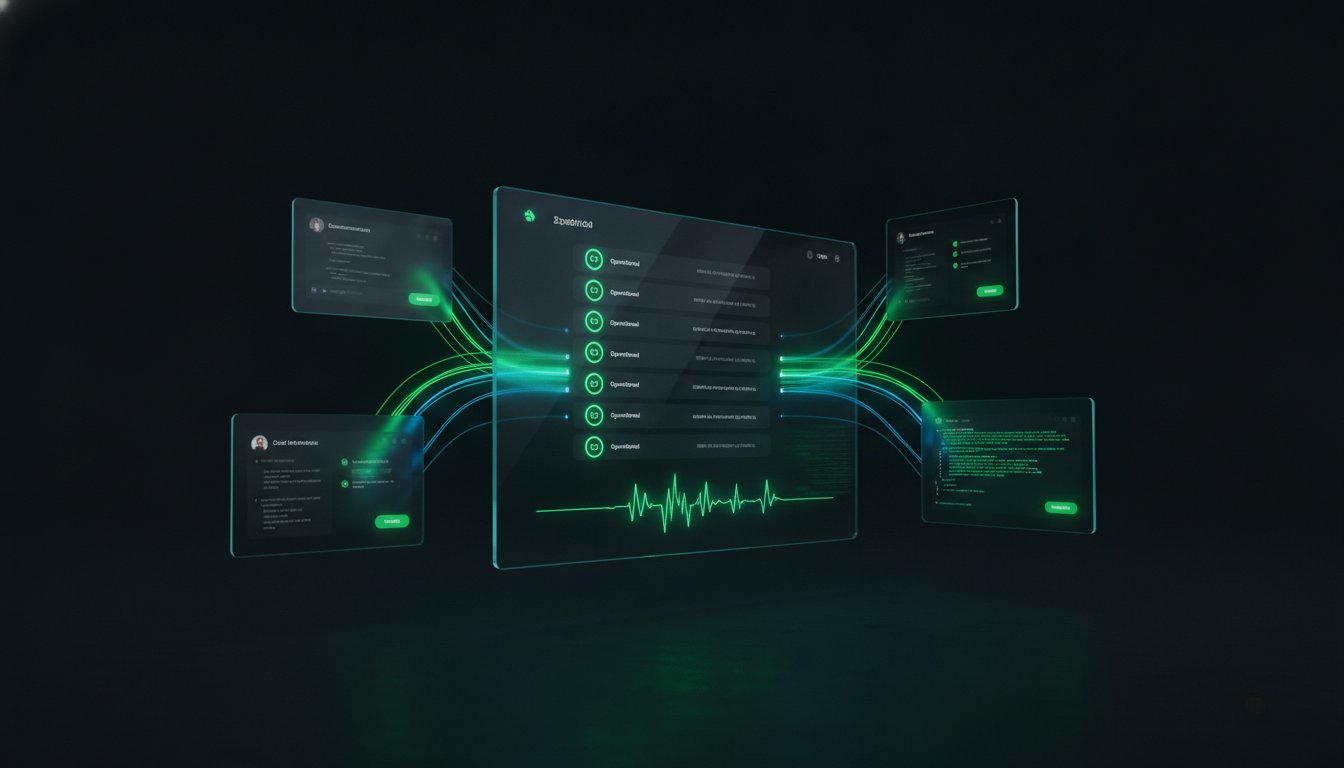
Phase 3 is Initial Communication. The goal is to update your status page within five minutes of detection. Even if you don't have the root cause yet, an "Investigating" status is the most important update you will ever write. It signals to your users and your support team that the engineering group is active. This single action can reduce incoming support tickets by up to 80% during a crisis. Using pre-defined templates for common scenarios like "Database Latency" or "CDN Connectivity Issues" reduces the cognitive load on your responders when stress is high. Platforms like StatusPulse link monitoring alerts directly to status page drafts, allowing you to move from detection to public acknowledgement with a single click. This integration ensures that your communication is as fast as your technical response.
Phase 4-6: Investigation, Mitigation, and Resolution
Once the public is aware, the focus shifts to technical execution. Phase 4 is Investigation. You must isolate the failure domain quickly. Is the latency originating in the database, the CDN, or the application logic? Effective teams use telemetry to narrow the scope before touching any code. This stage of An 8-Phase Incident Lifecycle from First Alert to Published Post-Mortem requires a cool head and a logical approach to debugging. Don't guess. Follow the data.
Isolation leads directly to Phase 5: Mitigation. Mitigation is about reducing the blast radius. You are not looking for the perfect fix yet. You are looking to stop the bleeding. This might involve rolling back a recent deployment, scaling up resources, or temporarily disabling a non-critical feature. Phase 6 is Resolution. This is the final commit that ensures the incident cannot recur in its current form. It is the permanent fix that addresses the root logic or architectural flaw discovered during investigation.
Mitigation vs. Resolution: A Critical Distinction
Mitigation and resolution are not the same. Mixing them up leads to recurring outages. For example, increasing a database connection pool is mitigation. Fixing the connection leak in your code is resolution. Mitigation restores service. Resolution prevents the problem from coming back.
Marking an incident "Resolved" prematurely damages developer credibility. If the symptoms vanish but the bug remains, the incident will likely resurface. IBM's guide to incident management highlights that operational efficiency depends on clear status transitions. Use a "Monitoring" status on your status page after mitigation. This confirms the fix is stable before you officially close the incident.
Technical Documentation during the Heat of the Moment
Maintain a continuous paper trail. Encourage responders to "log in public" within a central Slack or Discord channel. Capture every configuration change, shell command, and log snippet. This raw data is essential for the post-mortem archaeology in Phase 7. Avoid deleting logs or metrics that seem irrelevant during the crisis. They are often the smoking gun for root cause analysis. Using an all-in-one platform like StatusPulse ensures that your monitoring data and incident timeline are preserved in one place, making the transition to the post-mortem phase much smoother.
Phase 7: The Post-Mortem Archaeology
Phase 7 is where the real learning happens. It is the bridge in An 8-Phase Incident Lifecycle from First Alert to Published Post-Mortem that turns a technical failure into a future safeguard. Think of this stage as archaeology. You are digging through layers of logs, metrics, and chat history to reconstruct the truth. The goal is a technical autopsy. You aren't looking for a person to blame. You are looking for the reasons why the system allowed the failure to occur in the first place.
Effective archaeology requires cross-referencing monitoring data with deployment logs. If a latency spike aligns perfectly with a Kubernetes pod restart or a specific CI/CD pipeline execution, you have a lead. You must also identify the intentional trade-offs made during the response. Perhaps the team chose to prioritize speed over data consistency to restore service faster. Documenting these decisions is vital for future responders who might face similar high-pressure choices.
Drafting the Blameless Post-Mortem
Focus on "How" the system failed rather than "Who" made the mistake. A blameless culture is essential for honesty. If engineers fear retribution, they will hide the technical nuances that lead to root causes. Structure your document with four key sections: a high-level summary, a chronological timeline, the root cause analysis, and a list of specific action items. You can use AI incident management to generate the first draft of your timeline directly from uptime logs and Slack threads. This removes the manual labor of scrolling through thousands of timestamps to find the exact moment the database connection pool exhausted.
The 5-Whys Technique for SREs
Move past "human error" to find the architectural deficiency. If a developer pushed a bug, don't stop there. Why did the bug reach production? Perhaps the CI/CD pipeline lacked a specific integration test for that failure mode. Why was that test missing? Maybe the testing suite was too slow, leading the team to skip certain checks for non-critical services. Every "Why" must lead to a tangible action item. If an action item isn't trackable in your backlog, it doesn't count. The post-mortem is only successful when it results in a system that is fundamentally harder to break.
Ready to automate your technical archaeology? Try StatusPulse to link your monitoring logs directly to your post-mortem drafts.
Phase 8: Publication and Learning
The final phase of An 8-Phase Incident Lifecycle from First Alert to Published Post-Mortem is often the most neglected. Many teams treat "Learning" as a private ritual. They bury the post-mortem in a hidden folder. This is a mistake. Publication is the act of moving that document from an internal draft to your public status page. It is the definitive signal that the incident is closed and that your team has regained control of the infrastructure.
Transparency is a competitive advantage in the SaaS market. Users don't expect perfection, but they do expect honesty. Public reports should be sanitized for security. You don't need to share internal IP addresses or specific employee names. However, you must maintain technical honesty. If a misconfigured load balancer caused the outage, say so. This level of integrity builds a foundation of trust that marketing copy cannot replicate.
The Architecture of Public Transparency
Writing a public post-mortem requires a shift in language. Your customers aren't all SREs. You need to explain technical failures in a way that stakeholders understand without losing the technical core. For a deeper look at these strategies, see The Architecture of Incident Communication Transparency. This approach builds what we call the "Trust Dividend." Honest reports reduce customer churn. When users see a detailed explanation of a fix, they feel confident that the same error won't happen twice.
Operationalizing the Lessons Learned
Learning is useless if it isn't operationalized. If an action item doesn't make it into the next engineering sprint, the incident isn't actually over. You must close the loop. According to IBM (2025), organizations that have and regularly test an incident response plan save an average of $2.66 million per breach compared to those without. This saving is a direct result of operationalizing lessons from previous failures.
Operationalizing often involves updating monitoring thresholds based on the "early warning" signals you missed. If a CPU spike preceded the crash but didn't trigger an alert, adjust your configuration immediately. StatusPulse helps teams maintain this 8-phase cycle without the corporate bloat of legacy tools. We provide a straightforward platform for uptime monitoring and public status pages. You can choose between EU or US hosting to meet your data sovereignty requirements. This ensures your technical data flows directly into your communication channels, making the 8-phase lifecycle a natural part of your workflow.
Frequently Asked Questions
What is the difference between mitigation and resolution?
Mitigation is a temporary fix to restore service, such as restarting a server. Resolution is the permanent fix that addresses the root cause, such as patching the code that caused the server to crash.
How quickly should I update my status page?
The goal for Phase 3 (Initial Communication) is five minutes. Even if you don't have all the details, an "Investigating" status reduces support tickets and signals that your team is active.
Should every incident have a public post-mortem?
Minor issues may only require internal notes. However, any incident that impacts user workflows or violates an SLA should result in a public post-mortem to maintain transparency.
How can AI help in incident management?
AI can summarize technical logs and Slack threads into a draft timeline. This reduces the manual effort required to start a post-mortem, allowing engineers to focus on the technical analysis.
Operationalizing Your Incident Response Strategy
Effective incident management is a technical discipline. It requires moving beyond reactive fire-fighting to a structured, repeatable process. By adopting An 8-Phase Incident Lifecycle from First Alert to Published Post-Mortem, your team shifts from chaotic manual updates to a transparent workflow that prioritizes system stability and user trust. This structure reduces the volume of support tickets and ensures that every failure results in a tangible improvement to your infrastructure.
Reliability doesn't require complex corporate software or opaque pricing models. StatusPulse provides an integrated platform for uptime monitoring, AI-assisted incident management, and public status pages. We offer flat pricing with unlimited subscribers and the choice between EU or US hosting to support your data sovereignty needs. Our tools are built to assist your engineers without adding unnecessary friction to their workflow. You can start your 14-day free trial of StatusPulse today to begin building a more resilient service. Your users will appreciate the technical honesty; your engineers will appreciate the precision.
Frequently Asked Questions
What is the difference between an incident lifecycle and an incident response plan?
An incident lifecycle represents the chronological stages a failure passes through, while an incident response plan is the specific set of instructions your team follows. The lifecycle provides the framework for An 8-Phase Incident Lifecycle from First Alert to Published Post-Mortem, ensuring no step is skipped. The response plan details who is on call, which Slack channels to use, and how to access backup systems during those phases.
How soon should the first status update be published during an incident?
You should publish your first status update within five minutes of confirming an incident. Even if you haven't identified the root cause, an "Investigating" status signals to users that your engineering team is active. This immediate transparency prevents your support inbox from being overwhelmed by duplicate reports while you focus on the technical fix.
Can AI really help with incident management without making mistakes?
AI functions as an assistant that requires a final human action rather than an autonomous decision-maker. It excels at summarizing Slack threads and identifying log spikes to draft incident timelines quickly. While AI can significantly reduce the manual labor in Phase 7, a human specialist must always verify the technical accuracy of the final report to prevent hallucinated data or security leaks.
Should every minor bug follow the full 8-phase incident lifecycle?
No, the full lifecycle is reserved for service disruptions that impact user workflows or violate Service Level Agreements (SLAs). Minor UI bugs or internal tool hiccups can usually be handled through standard bug tracking. Applying the full 8-phase process to every minor glitch leads to process fatigue, making it harder for the team to respond with precision when a major outage occurs.
What is a blameless post-mortem, and why is it important for DevOps?
A blameless post-mortem focuses on how the system's architecture allowed a failure to occur rather than which individual made a mistake. This is vital for DevOps because it encourages engineers to be technically honest about their actions without fear of retribution. If a dev pushes a bug, the post-mortem asks why the CI/CD pipeline didn't catch it, leading to systemic improvements.
How do I choose between EU and US hosting for my status page?
Your choice depends on your primary user base and data sovereignty requirements. Organizations serving European customers often prefer EU hosting to align with GDPR standards, which require strict oversight of personal data processing. Conversely, US-based firms might choose US hosting to meet local regulatory expectations. StatusPulse provides both options on separate infrastructure to ensure your status page remains independent of your primary stack.
What are the most important metrics to track during the incident lifecycle?
The most critical metrics are Mean Time to Acknowledge (MTTA) and Mean Time to Resolve (MTTR). MTTA measures how quickly your team responds to an automated alert, while MTTR tracks the time from detection to a permanent fix. Tracking these across An 8-Phase Incident Lifecycle from First Alert to Published Post-Mortem helps you identify bottlenecks in your communication or technical resolution workflows.
How do I handle communication if our monitoring tool itself is down?
You must host your status page and monitoring on infrastructure entirely separate from your primary application. If your main service goes down, your status page should remain accessible to provide updates. Using an external provider like StatusPulse ensures that even a total data center failure on your end doesn't silence your communication channels, maintaining the trust you've built with your users.