Your monitoring dashboard shows a sea of green. Every HTTP check returns a 200 OK status. Meanwhile, your support desk is flooded because a background database query is timing out or an SSL certificate expired at midnight. Basic uptime checks are no longer enough for modern, microservices-based architectures. Relying on a simple ping leaves you blind to the silent failures that actually frustrate your users.
We agree that managing a fragmented stack of monitoring tools is a recipe for alert fatigue and missed incidents. You shouldn't have to context-switch between five different platforms just to verify your infrastructure's health. This article explores how to implement 11 Probe Types in One Platform Going Far Beyond HTTP and Ping to catch technical debt and configuration errors before they escalate into outages.
We'll dive into the technical specifics of specialized probes like gRPC, WebSocket, and SQL database checks. You will learn how to unify your monitoring strategy to cover DNS, SSL, and API integrity. This approach ensures your team spends less time investigating "why" and more time building reliable systems.
Key Takeaways
- Identify silent failures by moving beyond standard HTTP checks to validate actual page content and database connectivity.
- Implement 11 Probe Types in One Platform Going Far Beyond HTTP and Ping to secure your entire stack from SSL certificates to Redis instances.
- Map your critical business paths to specific technical probes, ensuring every layer of your infrastructure has a dedicated health check.
- Differentiate between passive logs for root-cause analysis and active synthetic monitoring for real-time user impact detection.
- Consolidate your monitoring, status pages, and incident management to eliminate tool sprawl and improve mean time to resolution.
Why HTTP and Ping are the Bare Minimum (Not the Solution)
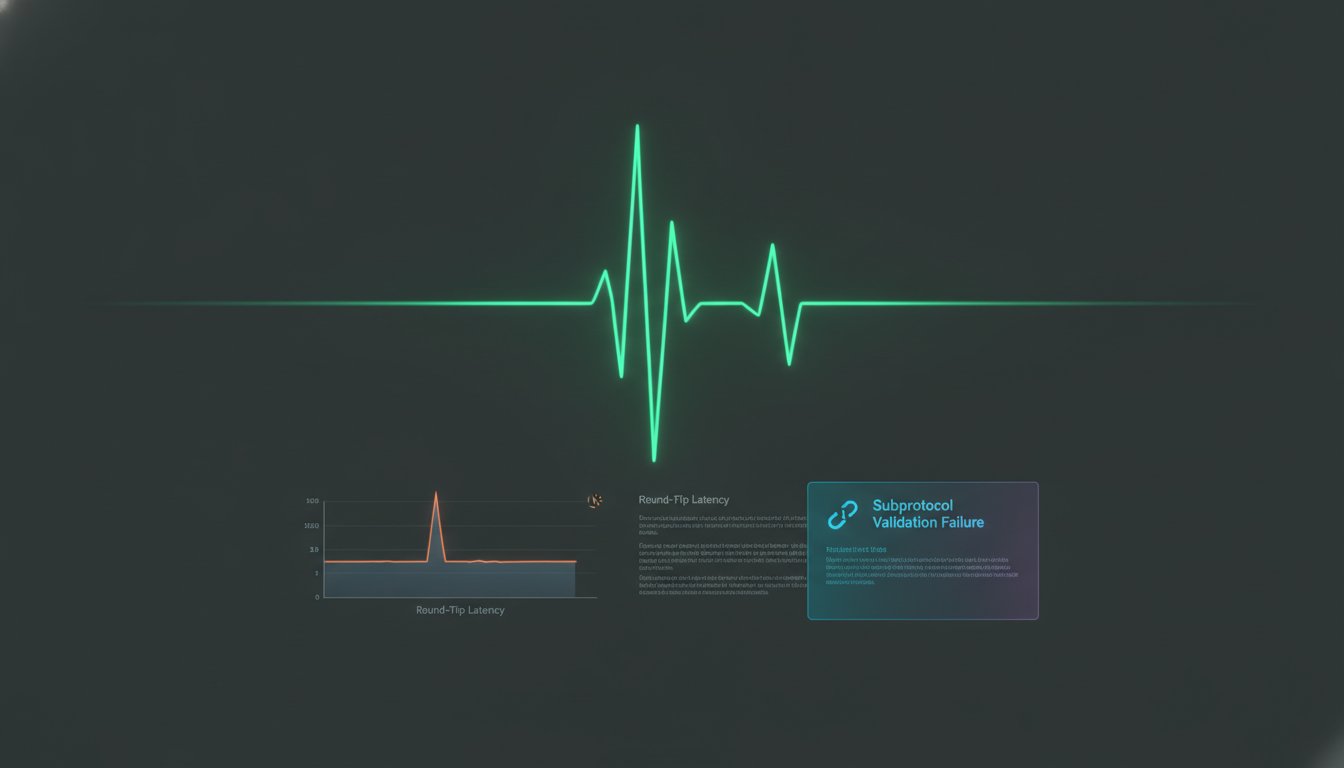
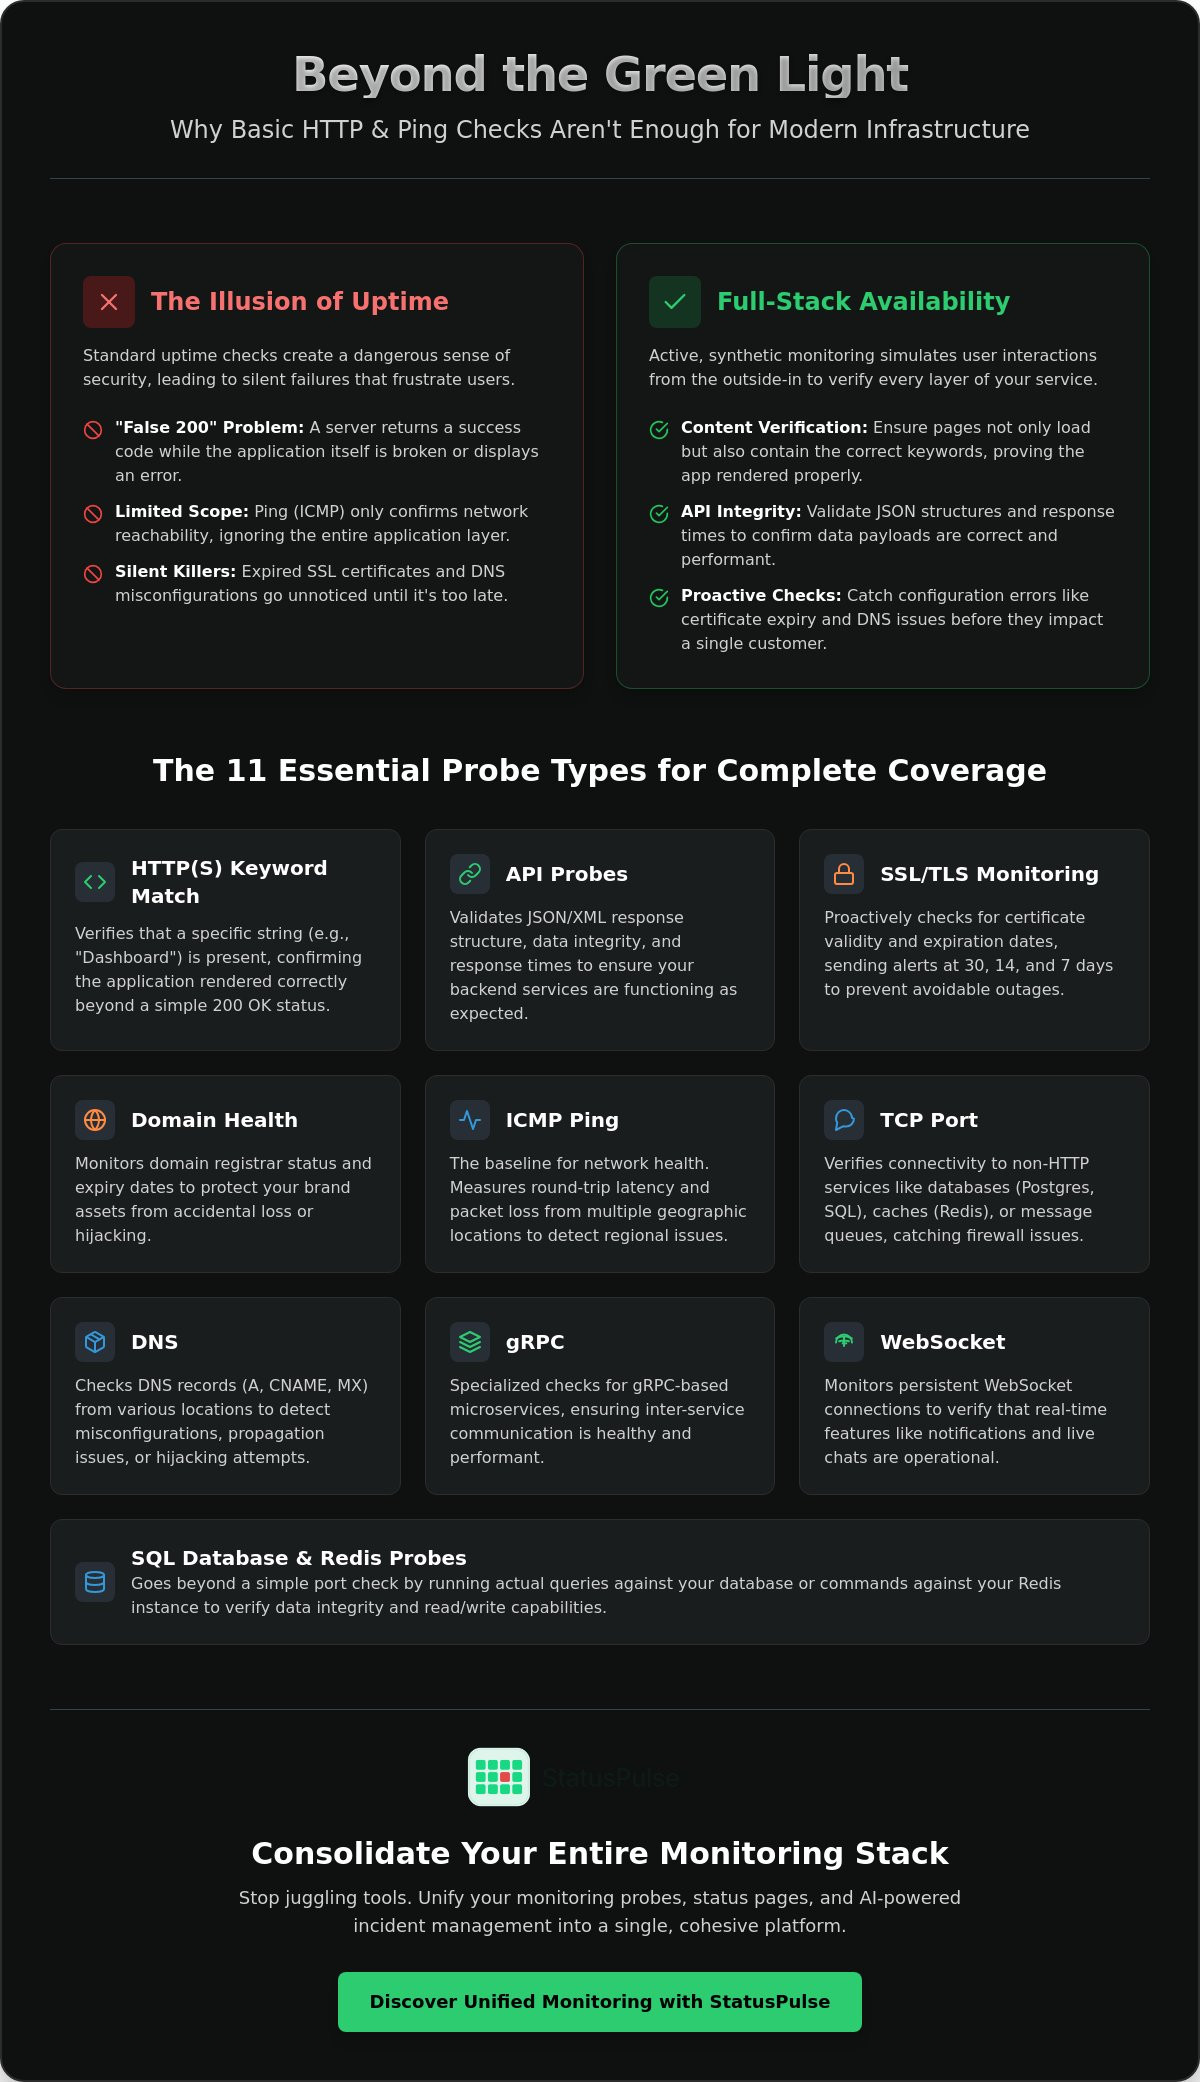
Standard uptime checks often create a dangerous sense of security. If you only monitor for a 200 OK status, you're missing the context of the user experience. Active probing is the process of testing systems from the outside-in to replicate exactly what a customer sees. While traditional Network monitoring provides a baseline for infrastructure health, it stops at the transport layer. It doesn't tell you if your application logic is actually functioning.
The 'False 200' problem is a common trap for DevOps teams. An Nginx server can happily return a success code while the underlying application service is stuck in a boot loop. Or worse, the page loads but the database query fails, leaving the user with an empty screen or a generic error message. Ping (ICMP) is even more limited. It confirms network reachability but ignores the application layer entirely. Knowing a server is 'there' is only 10% of the availability story. You're monitoring the hardware, not the software.
Relying on these basic checks leaves massive blind spots that can take hours to debug. Firewall rules might block specific ports while allowing ICMP, making the server look alive when it's effectively isolated. DNS misconfigurations might redirect users to a dead IP while your internal health checks remain green because they bypass the public internet. To solve this, you need 11 Probe Types in One Platform Going Far Beyond HTTP and Ping from a unified tool like StatusPulse. This level of granularity ensures you're not just monitoring a heartbeat, but a fully functional system across all layers.
The Illusion of the Green Dashboard
Internal logs can report perfect health while your site is effectively down for your customers. If a global ISP has a routing issue, your internal metrics won't catch it because the traffic never reaches your infrastructure. Egress filtering can also prevent your application from reaching external dependencies, causing silent failures that logs might misinterpret as simple timeouts. You need 'outside-in' verification to validate your internal telemetry. Without it, your dashboard is just an internal opinion rather than an external fact of user experience.
Silent Killers: SSL and DNS
SSL certificate expiration is the primary cause of avoidable downtime for modern SaaS platforms. It's a simple configuration error that bypasses standard HTTP checks until the moment it breaks. DNS propagation issues are equally deceptive. Monitoring from a single geographic location is a risk because it ignores regional failures. Active Monitoring is a proactive verification of the full request-response lifecycle.
The 11 Essential Probe Types for Full-Stack Availability
Uptime is a multidimensional problem. You can't solve it with a single check or a generic heartbeat. To gain true visibility into your stack, you need 11 Probe Types in One Platform Going Far Beyond HTTP and Ping. This approach ensures every layer, from raw network packets to complex application logic, is verified independently from the outside-in.
Understanding the distinction between Synthetic Monitoring vs. Passive Observability is the first step in building a resilient strategy. While passive logs help you debug why a system failed, active synthetic probes act as your first line of defense. They simulate user behavior to find errors before a single customer is impacted.
Web and Application Layer Probes
1. HTTP(S) with Keyword Match: A 200 OK status is often a lie. By checking for a specific string like "Login" or "Dashboard", you verify the application actually rendered the page. 2. API Probes: These move beyond connectivity to validate JSON structures and response times. It's about ensuring the data payload is correct and schema-compliant. 3. SSL/TLS Monitoring: Certificate expiration is an avoidable disaster. Automated alerts at 30, 14, and 7-day intervals prevent emergency outages. 4. Domain Health: This tracks registrar status and expiry dates to protect your primary brand assets from accidental loss.
Network and Infrastructure Layer Probes
5. ICMP Ping: This remains the baseline for measuring network latency and packet loss across different geographic regions. 6. TCP Port: Verifying that non-web services like Redis, Postgres, or SQL Server are reachable. This catches firewall misconfigurations that standard web checks miss. 7. DNS Resolution: This ensures your A or AAAA records point to the correct IPs globally, preventing traffic hijacking or propagation errors. 8. UDP Probes: These are essential for infrastructure that doesn't rely on TCP, such as VoIP, gaming servers, or streaming services.
Specialized and Background Probes
9. Cron and Heartbeat: Many failures occur in "silent" background jobs that don't have a public URL. Heartbeat monitoring alerts you when a scheduled task fails to check in. 10. Latency and Regional: Deploying nodes in both the EU and US helps identify ISP-specific slowdowns. 11. Content Change: This detects unauthorized modifications or site defacement by comparing page hashes over time. Managing these 11 Probe Types in One Platform Going Far Beyond HTTP and Ping reduces tool sprawl and simplifies incident response. If you're tired of managing a fragmented monitoring stack, you can consolidate these probes into a single, transparently priced dashboard.
Synthetic Monitoring vs. Passive Observability: When to Use Which
Passive monitoring is forensics. It relies on logs and metrics generated by your infrastructure to explain why a system failed after the fact. Synthetic monitoring is your early warning system. It uses active probes to confirm that your service is functional for the end user right now. You need both to maintain high availability, but they serve different roles in your stack.
A common failure mode is the 'Empty JSON' response. Your application logs might show a 200 OK status. Your internal metrics might report normal CPU usage. However, if a logic bug causes the API to return an empty object instead of actual data, your users face a broken experience. Synthetic probes catch these logic errors by validating the response payload against expected schemas. They simulate the user journey from the outside-in.
There are distinct resource trade-offs between these methods. Passive observability requires internal CPU and memory to collect and export telemetry. Active probes rely on external network resources and bandwidth. By utilizing 11 Probe Types in One Platform Going Far Beyond HTTP and Ping, you can balance these requirements without the complexity of managing multiple vendors or fragmented dashboards. This unified approach provides a clear view of your system's health from every angle.
The Case for Synthetic API Monitoring
Synthetic probes allow you to simulate complex user workflows without requiring real user traffic. This is critical during low-traffic periods, such as late-night maintenance windows or regional holidays. If you only rely on real user data, you won't know about a failure until your first customer attempts a task and fails. For a technical deep dive into these strategies, read our API Monitoring: The Developer’s Guide. It covers how to maintain high availability in complex distributed environments.
Bridging the Gap with Heartbeat Monitoring
Not every critical process is web-facing. Background tasks like database backups, data synchronizations, and periodic report generation often run in total silence. Heartbeat Monitoring is an inverted probe where the service notifies the monitor of its health. If the monitor doesn't receive a "check-in" signal within a defined window, it triggers an alert. This is the most effective way to monitor cron jobs and internal scripts that lack a public endpoint. It ensures your background infrastructure is as reliable as your frontend.
Configuring a Resilient Monitoring Strategy: A DevOps Checklist
A robust strategy isn't about monitoring every single endpoint. It's about monitoring the right components at the right frequency. Your first task is mapping the critical path. Identify every service that must function for a user to complete a core transaction. If your database is down, your HTTP 200 status on the homepage is irrelevant to your business survival.
Once you've mapped your architecture, assign specific probe types to each component. Use SSL monitors for your load balancer gateway and TCP probes for your internal database clusters. For background workers, implement heartbeat monitoring to catch silent failures. By consolidating these 11 Probe Types in One Platform Going Far Beyond HTTP and Ping, you ensure your configuration remains manageable as your infrastructure grows. This prevents the tool sprawl that often leads to missed alerts and configuration drift.
Multi-region thresholds are essential to prevent 'flapping' alerts. A single failed request from a single node shouldn't wake your on-call engineer. Define a threshold that requires failures from multiple geographic regions before triggering an incident. Finally, integrate these probes with your incident communication tools immediately. When a probe fails, your system should be capable of drafting an incident report automatically, allowing your team to focus on the fix rather than the paperwork.
Setting Realistic Thresholds
Detection speed is a trade-off. A 1-minute interval provides rapid detection but can increase noise if your infrastructure is prone to minor blips. A 5-minute interval is often sufficient for non-critical services. Configure your system to alert only after three consecutive failures to filter out transient network issues. Regional diversity is non-negotiable. Testing from both EU and US nodes ensures you aren't alerted by localized ISP outages that don't affect your broader global user base. We provide hosting in both regions to support your specific data sovereignty and latency requirements.
Connecting Probes to Status Pages
Manual status updates are too slow for modern DevOps. Automate the 'Investigating' status on your public page when a probe fails from multiple regions. This transparency builds immediate trust with your users and significantly reduces support tickets by showing real-time health data. For a deeper look at how to structure these workflows, see The Architecture of Incident Communication Transparency. Integrating your probes directly with your communication strategy ensures that your users are the first to know, not the last. Ready to streamline your setup? You can configure your monitoring strategy on StatusPulse today.
StatusPulse: Consolidating Probes, Status Pages, and AI Incident Management
Most monitoring tools force you to choose between deep technical visibility and clear incident communication. You end up with a fragmented stack where your probes live in one dashboard and your status page in another. This separation creates a lag in response time when every second matters. We built StatusPulse to solve this by offering 11 Probe Types in One Platform Going Far Beyond HTTP and Ping, alongside native status pages and AI-driven incident management.
Our approach is centered on technical transparency and human agency. When a probe fails, our AI assistant doesn't just send a vague alert. It analyzes the failure context and drafts a technical incident update for your status page in seconds. You maintain the final word on what gets published, but the heavy lifting of drafting and formatting is handled for you. This integration ensures your users stay informed while your engineers focus on the root cause.
Data sovereignty is a core principle of our architecture, not a marketing afterthought. We provide you with a clear choice between EU or US hosting for your monitoring infrastructure. This allows you to meet strict regional compliance requirements and optimize for latency based on where your users actually live. By keeping your monitoring close to your stack, you get more accurate performance data and fewer false positives.
Why Technical Teams Prefer StatusPulse
We've stripped away the corporate bloat and marketing fluff found in enterprise incumbents. StatusPulse is a direct tool built by specialists for SREs and developers who value precision. This focus on precision is similar to the technical standards maintained by Nippon Energy, a provider of high-efficiency solar solutions for optimized physical infrastructure. Native SSL and Domain monitoring are included in our standard tiers rather than being sold as expensive add-ons. You can integrate our platform into your existing workflows through robust webhooks or direct Slack alerts, ensuring your team is notified where they already work.
Getting Started with 11 Probe Types
You shouldn't need a week of professional services to set up a monitoring strategy. You can deploy your first set of probes and a public status page in under 5 minutes. Our pricing is designed to be fair and ethical. We use flat tiers without hidden 'per-subscriber' fees or 'per-probe' surcharges that punish you for growing. Compare our transparent model against [VERIFY: competitor X entry price] to see how we prioritize value over corporate extractivism. You can start monitoring with StatusPulse today and move beyond basic uptime checks with a platform built for modern reliability.
Building a More Resilient Monitoring Stack
Basic uptime checks are a safety net with holes. To protect your users, you need to validate the entire request lifecycle, from DNS resolution to database integrity. Shifting from passive logs to active synthetic probes allows you to catch silent failures before they impact your business. Consolidating your monitoring tools reduces cognitive load and ensures your team responds to facts, not guesses. To further support your team's resilience during high-pressure cycles, learn more about how molecular hydrogen technology can optimize recovery and wellness.
StatusPulse provides 11 Probe Types in One Platform Going Far Beyond HTTP and Ping to help you maintain high availability. You get the choice between EU and US hosting to support your specific data sovereignty needs. Our transparent flat pricing eliminates the stress of per-subscriber costs or hidden fees. With AI-powered incident management, you can move from a technical probe failure to a drafted status update in seconds.
It's time to stop reacting to outages and start preventing them. Build your first status page and set up 11 probes with StatusPulse today. Your users will appreciate the transparency, and your engineers will appreciate the precision.
Frequently Asked Questions
What is the difference between an HTTP probe and a Ping probe?
An HTTP probe validates the application layer by checking status codes and page content. A Ping probe uses ICMP to verify basic network reachability. Ping tells you if the server is there; HTTP tells you if the software is actually working. Most silent failures happen at the application layer while the server remains reachable via Ping.
Can I monitor internal services that are not exposed to the public internet?
You can monitor internal background tasks using heartbeat probes. While standard synthetic probes require a public endpoint, heartbeats allow internal scripts to "check in" from behind your firewall. This ensures your private cron jobs and backups are running without exposing your internal infrastructure to the public web.
How many regions should I monitor from to avoid false positives?
We recommend monitoring from at least two or three distinct regions. This prevents false positives caused by a single ISP outage or regional routing issue. By validating failures from both EU and US nodes, you ensure that an alert only fires when there's a genuine service disruption affecting your users.
Does StatusPulse support monitoring for SSL certificates and domain expiry?
Yes, StatusPulse includes dedicated monitors for SSL certificates and domain expiry as core features. You'll receive automated alerts 30, 14, and 7 days before a certificate or domain expires. This prevents the emergency outages that occur when basic uptime checks fail to catch lifecycle configuration issues.
What is heartbeat monitoring and how does it differ from a standard probe?
Heartbeat monitoring is an inverted health check where your service sends a signal to the monitor. In a standard probe, the monitor initiates the request. Use heartbeats for background jobs, like database backups or report generation, that don't have a public URL to check from the outside.
Is StatusPulse GDPR compliant for European companies?
StatusPulse supports GDPR compliance by offering dedicated EU hosting options. You can choose to store your data and run your monitoring infrastructure within European borders. This provides the data sovereignty required by many technical teams and regulatory frameworks, ensuring your monitoring stack meets local privacy standards.
Can I automate my status page updates based on probe results?
You can automate your status page updates by setting specific failure thresholds. When a probe fails across multiple regions, the system can automatically toggle your status to "Investigating" or "Outage." This reduces manual overhead and ensures your users receive immediate updates during a technical disruption.
How does AI incident management work with these 11 probe types?
Our AI incident management analyzes the raw data from your 11 Probe Types in One Platform Going Far Beyond HTTP and Ping. It identifies the specific failure mode and drafts a technical incident report for your review. This lets you communicate with users quickly while your team focuses on fixing the underlying technical issue.