A successful HTTP 101 Upgrade status code is often a lie. You have likely seen your monitoring dashboard report a healthy connection while your users are actually staring at a frozen live feed or a broken chat interface. This happens because most basic checks stop at the handshake. They verify that the door is open but never check if the application logic is actually responding. To fix this, you need Real WebSocket Monitoring That Validates Subprotocols and Round-Trip Latency Beyond the Handshake to ensure your persistent streams are truly functional.
We understand the pressure of managing real-time systems where silent failures and hidden latency spikes are the norm. It is frustrating when a load balancer or proxy passes the initial handshake but chokes on the specific subprotocol data. In this guide, you will learn how to move beyond simple uptime checks. We will show you how to validate the integrity of custom subprotocols like STOMP or WAMP and how to capture precise RTT data throughout the connection lifecycle. We will explore technical setups that detect application-level stalls, helping you reduce your mean time to recovery when services falter.
Key Takeaways
- Learn why a successful HTTP 101 Upgrade is an insufficient health signal and how it often masks critical application-level failures.
- Validate that your server correctly negotiates requested subprotocols using the Sec-WebSocket-Protocol header to prevent silent data processing errors.
- Measure precise round-trip latency (RTT) using the protocol's native "Ping-Pong" mechanism to identify performance degradation in persistent streams.
- Deploy Real WebSocket Monitoring That Validates Subprotocols and Round-Trip Latency Beyond the Handshake to move your observability beyond shallow connection checks.
- Configure alerts based on stateful metrics and choose hosting regions that respect data sovereignty while providing accurate, localized latency data.
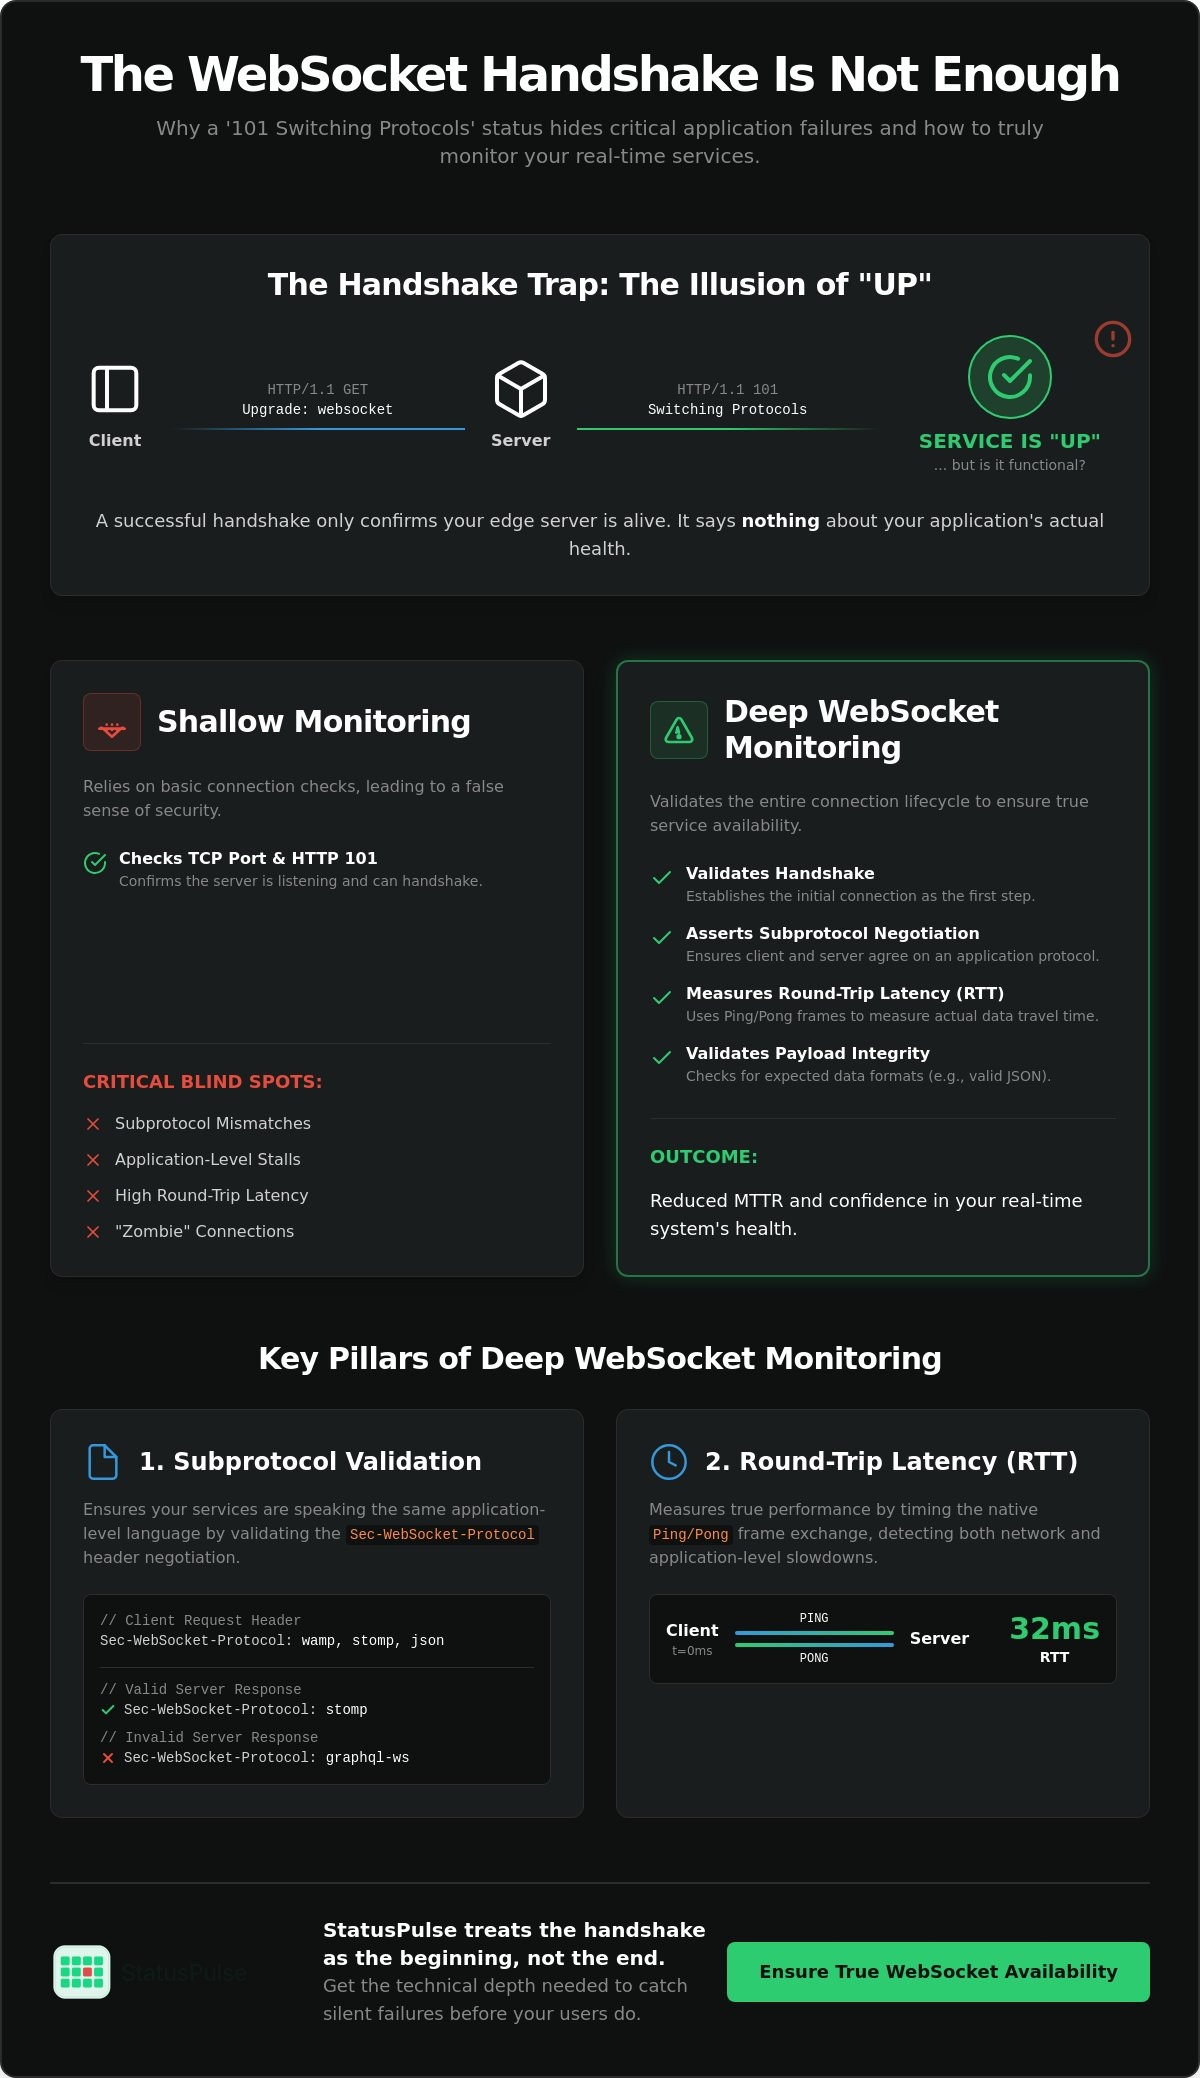
The Handshake Trap: Why HTTP 101 Does Not Equal Service Availability
The WebSocket protocol begins its life as a standard HTTP/1.1 request. By using the Upgrade header, a client asks the server to transition from a request-response model to a persistent, bidirectional stream. This process is governed by RFC 6455. When the server agrees, it sends back an HTTP 101 Switching Protocols response. For many legacy monitoring tools, this 101 status code is the finish line. If the handshake completes, the service is marked as "Up." This is a dangerous oversimplification. A successful handshake only proves that your edge server or load balancer is configured correctly. It does not guarantee that the underlying application logic is functional or that data is actually flowing.
Shallow monitoring stops at the negotiation phase. It ignores the fact that a socket can be technically "open" while being functionally "dead." Real WebSocket Monitoring That Validates Subprotocols and Round-Trip Latency Beyond the Handshake is required to bridge this gap. Without stateful validation, you are blind to application-level deadlocks that occur after the initial connection is established.
Common Post-Handshake Failure Modes
Many critical failures happen in the milliseconds following a successful handshake. One frequent issue is the immediate closure of a socket due to authentication timeouts. If your application expects a JWT or an auth frame immediately after the upgrade and doesn't receive it, it will drop the connection. Basic uptime checks rarely account for this secondary step. Another failure mode involves the application-level state machine. The backend might accept the connection but fail to initialize the specific resources needed for that user session, leading to a "zombie" connection that stays open but transmits no data. Finally, load balancers often have aggressive idle timeouts. They might sever a persistent connection that hasn't sent a frame recently, even if the application intends to keep it alive for hours.
The Problem with Basic Uptime Checks
Traditional monitoring tools often rely on simple TCP port checks or basic HTTP status code verification. A TCP check confirms that a port is listening, but it cannot distinguish between a healthy WebSocket server and a hung process that is still accepting connections. This creates a false sense of security. In real-time environments, like collaborative editors or live trading dashboards, a connection that handshakes but fails to stream data is worse than a total outage. It leaves users in a state of limbo where the UI reports a "connected" status, but no updates arrive. This silent failure increases your mean time to recovery because your dashboard stays green while your support tickets spike. Effective observability requires a tool that stays on the line to verify the connection remains viable over time.
At StatusPulse, we treat the handshake as the beginning of the check, not the end. Our monitoring probes are designed to maintain the connection and validate that the application is actually responding to frames. By moving beyond the 101 status code, we provide the technical depth needed to catch these silent disruptions before your users do.
Validating Subprotocols: Beyond Basic String Matching
Subprotocols define the application-level language spoken over a raw socket. Without them, your client and server are just passing untyped bytes back and forth. The negotiation for these languages happens during the initial handshake via the Sec-WebSocket-Protocol header. According to the WebSocket living standard, the client proposes a list of supported subprotocols, and the server must select exactly one from that list to return in its response. If your monitoring tool ignores this header, it might miss a configuration error where the server falls back to a default protocol that your frontend doesn't actually support. Real WebSocket Monitoring That Validates Subprotocols and Round-Trip Latency Beyond the Handshake ensures that this negotiation is not just present, but technically correct.
Validating the subprotocol name is only the first step. You must also verify the internal payload structure. Simple string matching is often too brittle for modern real-time applications. If your monitor only looks for a "success" string, it might miss malformed JSON objects that cause your production frontend to crash. Deep monitoring involves checking for specific keys in a JSON response or verifying binary headers in a proprietary stream. This level of scrutiny catches logic errors that occur after the connection is established but before the first user reports a failure. Heartbeats and ping-pong frames are also critical. While the protocol has native opcodes for pings, many subprotocols implement their own heartbeats at the application level. Your monitoring should track these frames to ensure the application state machine hasn't stalled.
Monitoring STOMP and WAMP Architectures
STOMP (Simple Text Oriented Messaging Protocol) requires a very specific frame sequence to function. A robust monitor should not only connect but also send a CONNECT frame and wait for the CONNECTED response from the server. If the server accepts the socket but fails to acknowledge the STOMP handshake, the service is effectively down. Similarly, in WAMP (Web Application Messaging Protocol) environments, monitoring must detect subscription failures within the persistent stream. A monitor should verify that the server returns a SUBSCRIBED message rather than a silent failure or an unexpected GOODBYE frame. Detecting these malformed patterns requires a tool that understands the message lifecycle.
Custom Subprotocol Validation Logic
Proprietary or binary protocols require more flexibility than standard tools provide. You might need regex-based validation to ensure the first few bytes of a stream match a specific binary pattern. Some servers are designed to send a mandatory "Welcome" message immediately upon connection. If this message is missing or malformed, the application state is invalid. You should also monitor for protocol-specific error codes. For instance, an application might send a 4001 custom error code within a data frame rather than closing the socket with a standard 1000 code. For teams needing this level of granular detail, StatusPulse provides stateful WebSocket probes that validate these specific application-level responses without adding unnecessary complexity to your stack.
Measuring True Round-Trip Latency (RTT) in Persistent Streams
Handshake time is a one-off event. It measures the overhead of DNS resolution, the TCP three-way handshake, and SSL/TLS negotiation. While these metrics matter for initial load times, they tell you nothing about the health of a connection that has been open for twenty minutes. Real WebSocket Monitoring That Validates Subprotocols and Round-Trip Latency Beyond the Handshake requires continuous measurement of the application-level response time. If your monitoring stops after the 101 Switching Protocols response, you are missing the most critical phase of the connection lifecycle.
Network congestion affects persistent streams differently than standard HTTP requests. Since WebSockets rely on a single, long-lived TCP connection, they are highly susceptible to head-of-line blocking. If a single packet is lost or delayed, the entire stream stalls until the missing data is retransmitted. This can cause massive latency spikes that a simple uptime check will never see. A comparative analysis of WebSocket latency shows that these spikes often correlate with server-side buffer bloat rather than raw network distance. Monitoring the RTT within the stream is the only way to detect these stalls before they impact your users.
Handshake Latency vs. Application RTT
- Handshake Latency: This covers the "door-opening" phase, including DNS, TCP, and the HTTP Upgrade. It's a measure of your infrastructure's reachability.
- Application RTT: This measures the time it takes for a message to be sent, processed by the backend logic, and echoed back to the client. It's a measure of your application's actual performance.
Application RTT is the superior metric for user-perceived performance. A fast handshake doesn't matter if the backend takes 500ms to process every incoming frame. At StatusPulse, we track both metrics to ensure you aren't fooled by a "green" handshake that hides a sluggish application.
Detecting Latency Degradation Over Time
Performance doesn't always fail in a single moment. You might encounter a "slow leak" where RTT increases by 10ms every hour as server-side message queues grow or memory fragments. Round-trip time (RTT) is the delta between a client-sent ping and the server-received pong. Tracking this delta over hours or days allows you to identify resource exhaustion before it triggers a crash. Multi-region monitoring is essential here. By comparing RTT from both EU and US nodes, you can quickly determine if a latency spike is a global backend issue or a localized peering problem affecting a specific geographic segment of your user base.
Architecting a Robust WebSocket Monitoring Strategy
Monitoring is more than a collection of pings. It requires a structured approach to distinguish between normal network jitter and genuine application degradation. Real WebSocket Monitoring That Validates Subprotocols and Round-Trip Latency Beyond the Handshake begins with establishing a baseline. You cannot set an effective alert if you don't know what "normal" looks like for your specific subprotocol negotiation. Once you have a week of data, you can configure alerts that trigger when the server returns an unexpected subprotocol or when latency drifts outside established bounds.
A complete strategy must also address transparency. Integrating WebSocket health metrics into a public status page helps manage user expectations during disruptions. For real-time services, users are often more frustrated by silent performance degradation than by a declared outage. Showing live RTT data alongside uptime proves that you are monitoring the actual quality of the service, not just the network reachability.
Setting Realistic Thresholds
Average latency is a misleading metric for WebSockets. It smooths over the very spikes that cause UI lag or message drops. Use the 95th percentile (p95) RTT instead. This ensures you are monitoring the experience of your most impacted users. You should also account for regional variance. A 150ms RTT might be critical for a user in the same region as your server but normal for a trans-Atlantic connection. Define "warning" states for p95 drift and "critical" states for complete subprotocol negotiation failures.
Synthetic Interaction Scripts
Synthetic checks should mimic real user interaction patterns rather than just pinging the socket. A robust script follows a logical lifecycle: initiate the connection, negotiate the subprotocol, subscribe to a topic, and send a test message. Validating the expected response at each step ensures that your application-level state machine is healthy. These scripts are vital for detecting regressions in new deployments where the handshake succeeds but the message routing fails. You can monitor WebSocket streams with StatusPulse to automate these multi-step interactions across global nodes and receive alerts before users report issues.
Using these scripts allows you to catch issues like authentication timeouts or subscription failures that traditional uptime checks miss. By simulating the full user session, you verify that every layer of your stack, from the load balancer to the database-backed message broker, is performing its role. This proactive approach reduces your mean time to recovery by pinpointing exactly where the interaction chain broke.
How StatusPulse Handles Deep WebSocket Observability
StatusPulse addresses the "shallow check" problem by using stateful probes that maintain a connection long after the initial handshake. We designed our platform to move beyond the HTTP 101 status code, providing Real WebSocket Monitoring That Validates Subprotocols and Round-Trip Latency Beyond the Handshake. Our probes act as a real client. They negotiate the subprotocol, send frames, and measure the time it takes for your application to respond at the logic layer. When a failure occurs, such as a subprotocol mismatch or an RTT spike, the data feeds directly into our AI-driven incident management system. This ensures that technical teams receive context-rich alerts rather than vague "service down" notifications.
Transparency is a core part of our philosophy. Many industry incumbents use complex, usage-based pricing models that charge per connection or per subscriber. We opt for a flat, transparent pricing structure. This approach eliminates the financial stress of scaling your monitoring as your user base grows. You get professional-grade observability without the corporate bloat or hidden fees often found in enterprise software contracts.
Native Support for Subprotocol Validation
Within the StatusPulse dashboard, you can configure specific Sec-WebSocket-Protocol headers to match your application requirements. We provide real-time visualization of RTT trends, allowing you to see how latency evolves over the life of a persistent connection. These metrics aren't just for internal use. You can link these deep performance signals to your public status pages. By showing users the actual health of your real-time streams, you build trust through technical honesty. If a specific subprotocol is experiencing degradation, your status page can reflect that specific reality rather than a generic "partial outage" message.
Data Sovereignty and Global Monitoring
Accurate latency monitoring requires probes that originate from regions where your users actually live. StatusPulse gives you the choice between EU and US hosting for your monitoring infrastructure. This is not just about reducing monitoring-induced latency; it is about data sovereignty. For teams operating under GDPR or similar regional regulations, having the option to keep monitoring data within EU borders is a critical requirement. We provide the technical depth of a specialized tool with the ethical foundations of a principled team. You can start monitoring your WebSockets with StatusPulse today to ensure your real-time services are performing exactly as intended.
Moving Beyond the Handshake for Reliable Real-Time Streams
A successful handshake is the bare minimum for connectivity. It doesn't guarantee that your subprotocols are negotiating correctly or that your messages are arriving on time. To maintain a truly healthy service, you need Real WebSocket Monitoring That Validates Subprotocols and Round-Trip Latency Beyond the Handshake. This approach moves your observability from network-level checks to actual application-level validation. It ensures that silent stalls and protocol mismatches are detected before they degrade the experience for your end users.
StatusPulse provides this technical depth with a focus on integrity. We offer both EU and US hosting options to support your data sovereignty requirements. Our platform includes AI-powered incident drafting to help you communicate faster when performance drifts. We believe in transparent pricing without hidden per-subscriber fees, making professional monitoring accessible to focused teams. By measuring true RTT and validating the entire connection lifecycle, you can reduce your mean time to recovery and maintain high standards for real-time performance.
Stop guessing and start validating your WebSockets with StatusPulse. Your real-time applications deserve monitoring that understands the protocol as well as you do.
Frequently Asked Questions
What is the difference between WebSocket handshake monitoring and RTT monitoring?
Handshake monitoring only validates the initial HTTP Upgrade request and the resulting 101 Switching Protocols status code. It confirms that your server or load balancer is reachable and configured to accept connections. RTT monitoring measures the continuous performance of an active session by timing how long it takes for a data frame to travel to the server and back. While the handshake is a one-time event, RTT monitoring provides ongoing visibility into application-level latency and network stability.
Can I monitor custom subprotocols with standard uptime tools?
Most standard uptime tools are insufficient for custom subprotocols because they stop after the connection is established. Validating subprotocols like STOMP, WAMP, or proprietary binary formats requires a stateful monitor that can send protocol-specific frames and parse the responses. Without this capability, your monitor cannot tell if the server actually accepted the subprotocol or if it simply ignored the request while keeping the raw socket open.
How often should I run synthetic WebSocket checks to avoid server load?
Most technical teams run synthetic checks every 1 to 5 minutes to balance observability with resource consumption. Because WebSockets are persistent, the overhead of maintaining a single monitoring connection is generally lower than making repeated new HTTP requests. You should monitor your server's connection limits and CPU usage to ensure that your probe frequency doesn't interfere with real user traffic during peak periods.
Why does my WebSocket monitor show "Up" when users report they can’t send messages?
This discrepancy occurs when your monitoring tool only checks the initial connection state. Real WebSocket Monitoring That Validates Subprotocols and Round-Trip Latency Beyond the Handshake is necessary to detect when the application logic has stalled. If the handshake succeeds but the message broker or backend database is hung, a basic check will stay green while the service is functionally dead for your users.
Is it possible to monitor WebSockets behind a load balancer or proxy?
Yes, you can monitor WebSockets through intermediaries, but you must ensure your probes support the WSS protocol and appropriate headers. Proxies and load balancers often have specific idle timeouts that can sever persistent connections. Your monitoring strategy should include regular heartbeats or ping frames to keep the connection alive and verify that the intermediary is not silently dropping traffic after the handshake.
How does network jitter affect WebSocket round-trip latency measurements?
Network jitter introduces variability in RTT that can be misinterpreted as server-side slowness. Since WebSockets rely on TCP, a single delayed packet can trigger head-of-line blocking, causing a sudden spike in perceived latency for the entire stream. It is better to track the 95th percentile (p95) of your RTT measurements rather than the average. This helps you distinguish between occasional network jitter and persistent performance degradation in your backend.
What are the security implications of automated WebSocket monitoring?
Automated monitoring requires your probes to authenticate just like a real user. You should use dedicated service accounts with restricted permissions and rotate your API keys or tokens regularly. Ensure your monitoring provider uses encrypted WSS connections to protect data in transit. It is also a good practice to whitelist the IP addresses of your monitoring probes in your firewall to prevent them from being flagged by rate-limiting or DDoS protection systems.
Should I use a separate monitoring agent for EU and US traffic?
Using regional probes is the only way to get accurate latency data for a global user base. RTT is physically limited by the speed of light and the number of network hops, so a probe in the US will always report higher latency to an EU server than a local probe would. Deploying agents in both regions also helps you support data sovereignty by ensuring that monitoring traffic originates and stays within specific legal jurisdictions when required.