

A 200 OK status code is often a lie. It tells you the server responded, but it doesn't tell you if your checkout button vanished or if a third-party script corrupted your pricing table. You've likely felt the exhaustion of alert fatigue from false positives or the sting of a silent failure where the page loads while the content remains broken. Many legacy web page monitoring tools still prioritize simple pings over the actual user experience, leaving developers to find bugs through customer complaints rather than automated logs.
You deserve a system that alerts you when things actually break, not just when a heartbeat skips. This guide explains how to select and implement a monitoring stack that balances infrastructure uptime with precise front-end change detection. We'll examine the technical implementation of reliable alerting, visibility into SSL and API health, and practical ways to reduce your mean time to detection (MTTD) without the bloat of complex pricing models.
Key Takeaways
- Distinguish between server availability and front-end integrity to catch failures where a page loads but the content remains broken.
- Evaluate web page monitoring tools based on regional execution and check frequency to ensure data reflects your actual user base.
- Prioritize monitoring for critical paths like checkout and login endpoints rather than monitoring the homepage in isolation.
- Reduce alert fatigue by implementing flap detection and establishing healthy baselines to filter out transient network noise.
- Use public status pages to transform internal monitoring data into a clear trust signal for customers and stakeholders.
Defining the Scope: Uptime vs. Content Change Monitoring
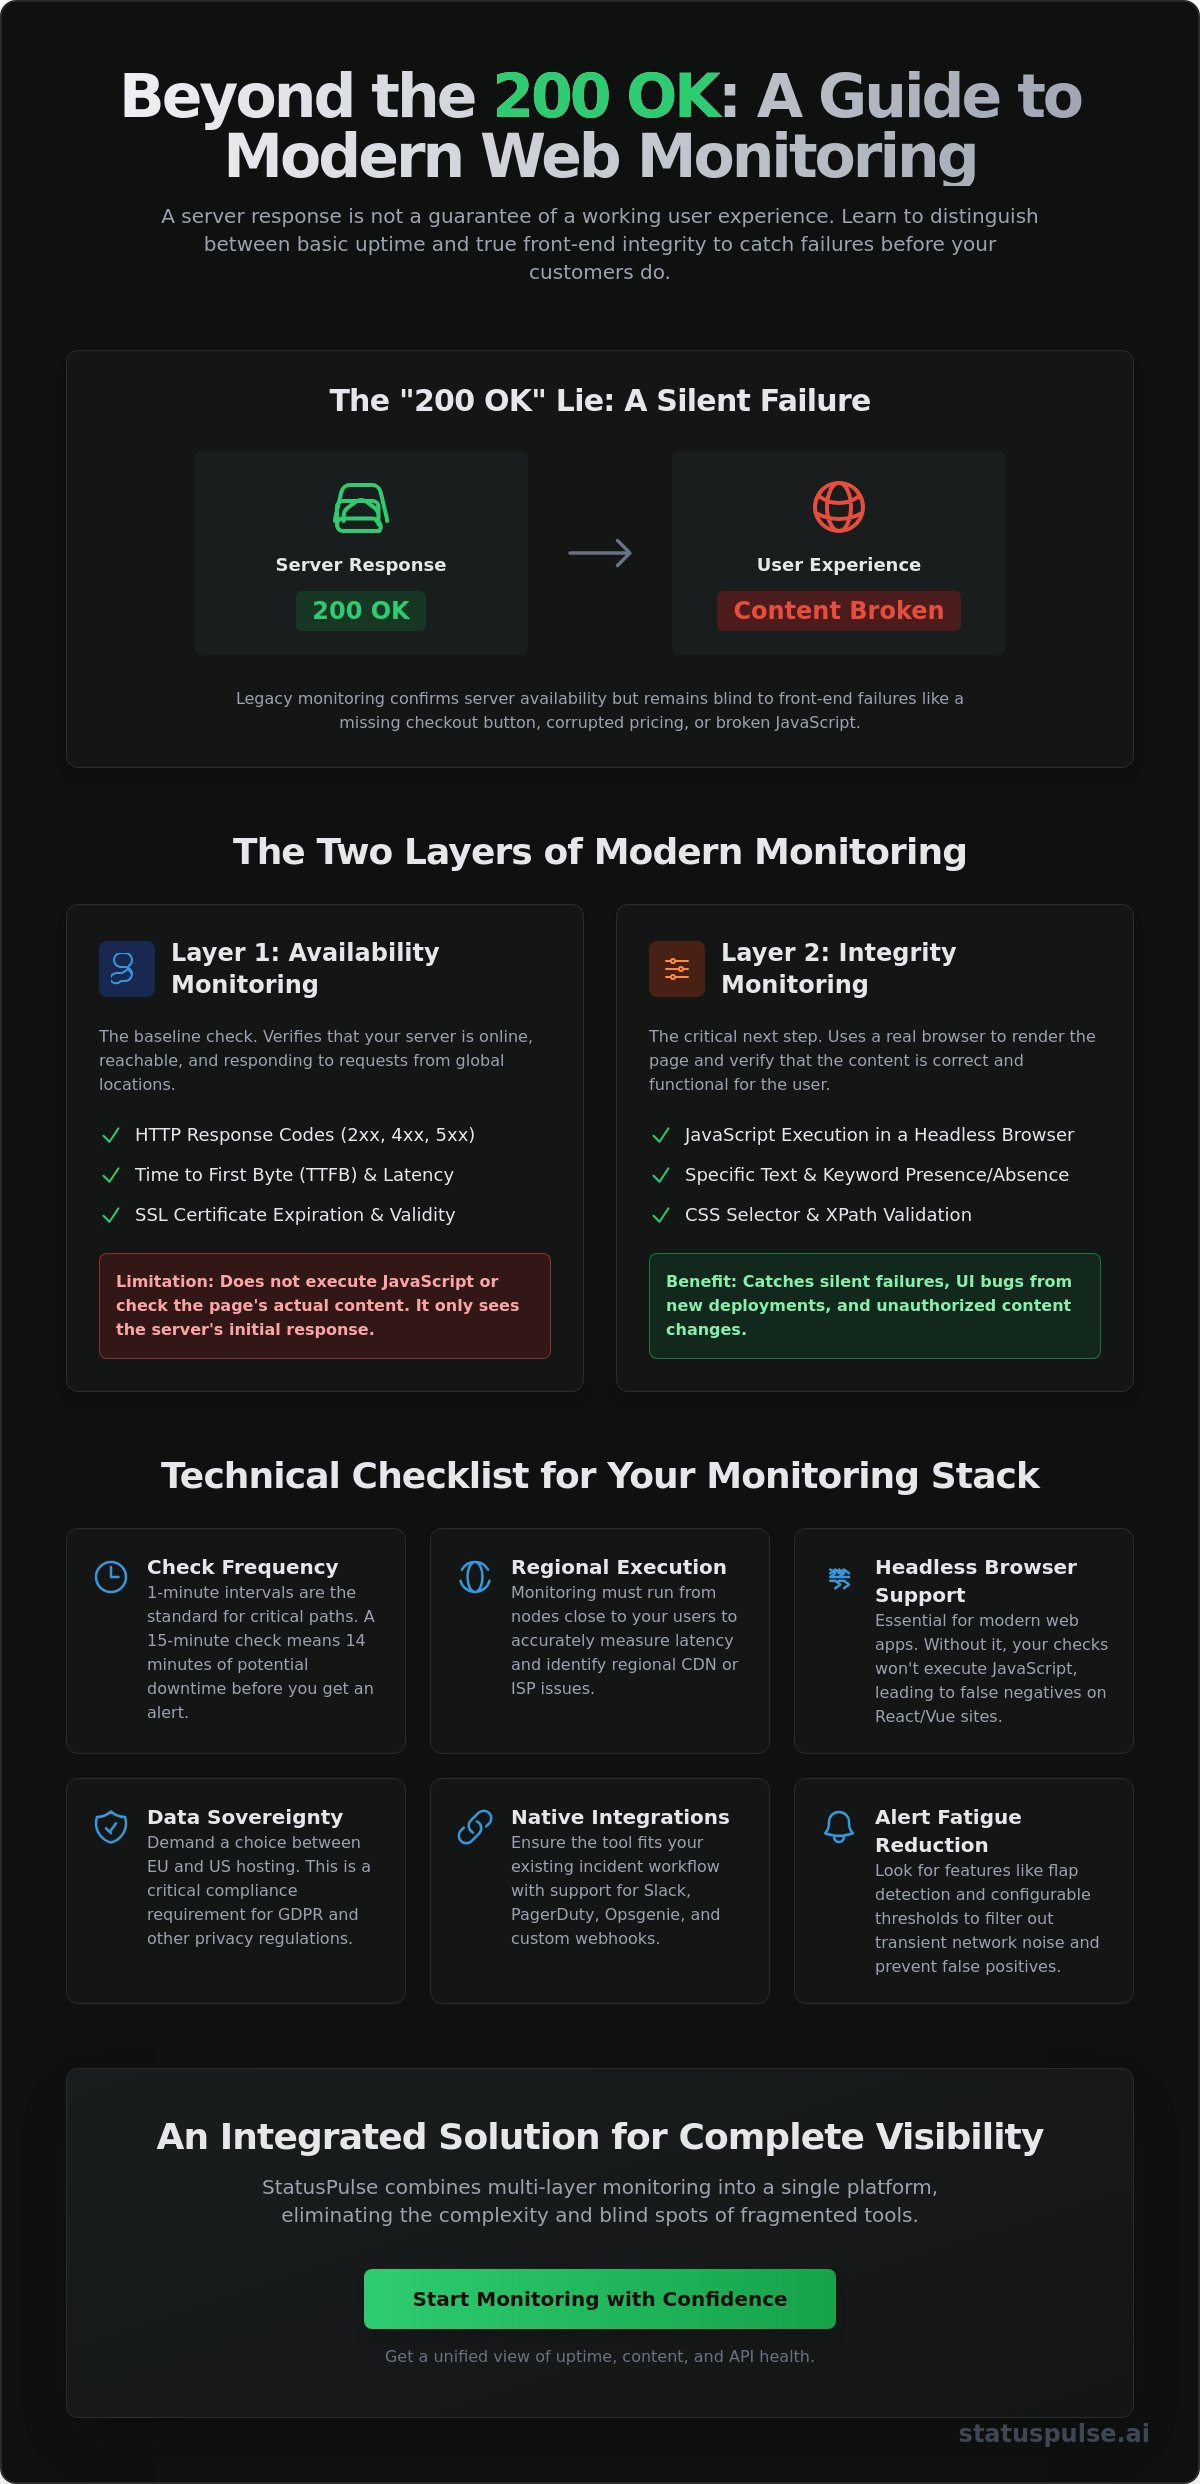
Effective monitoring requires a multi-layered strategy. Most web page monitoring tools categorize their functions into two primary areas: availability and integrity. Availability monitoring, or uptime, is the baseline. It verifies that your server is reachable and responding to requests. Integrity monitoring, however, goes deeper by verifying that the content served to the user is correct and functional.
A common mistake in DevOps is treating these as interchangeable. They aren't. For a detailed website monitoring overview, we see that infrastructure health doesn't always equal a working user interface. A "silent failure" occurs when your server returns a 200 OK status code, but the page content is missing, corrupted, or visually broken. This is why a professional stack must cover both the network layer and the rendered DOM.
The Role of Uptime Monitoring
Uptime monitoring acts as your first line of defense. It focuses on the transport and network layers. This involves tracking HTTP response codes to identify 500 Internal Server Errors or 404s. Beyond simple status codes, it measures performance metrics like Time to First Byte (TTFB) and global latency. By testing from multiple geographic regions, you can identify if a specific CDN node or regional ISP is causing a bottleneck. This layer detects network-level issues before they ever reach the rendering stage.
The Role of Change Detection
Change detection moves the monitoring logic into the browser. Modern tools use headless browsers to execute JavaScript and render the full page. This allows you to monitor specific CSS selectors or XPaths for critical text strings. For example, you can alert your team if the word "Stock" changes to "Unavailable" on a high-traffic product page. It also serves as a security check. Unauthorized script injections or unintended UI regressions from a fresh deployment are caught here, even if the server itself is perfectly healthy.
Integrating these functions is where many teams struggle. Most legacy providers force you to buy separate products for uptime, SSL monitoring, and visual changes. We built StatusPulse.ai to solve this fragmentation. By combining infrastructure checks with front-end integrity, you get a single source of truth. This reduces the need for complex, multi-tool integrations that often scale poorly as your architecture grows.
Technical Selection Criteria for Monitoring Stacks
Choosing web page monitoring tools isn't just about finding a dashboard that looks good. It's a technical decision that impacts your Mean Time to Detection (MTTD). If your check frequency is set to 15 minutes, a critical failure could persist for a quarter of an hour before you even get a ping. For high-stakes environments, 1-minute intervals are the standard. You should also verify that your provider uses headless browsers. Without them, your monitor won't execute the JavaScript required by modern frameworks like React or Vue. This leads to false negatives where the page appears "up" but is actually a blank white screen.
Regional execution is another non-negotiable. Your monitoring nodes should reside where your users do. If your primary audience is in Germany, a monitoring node in Virginia won't capture the latency or peering issues specific to your local users. This technical alignment ensures that your data reflects reality rather than an idealized network path. Effective E-commerce monitoring strategies rely on this regional accuracy to protect revenue during peak traffic periods. Finally, ensure your tool supports native integrations for Slack, PagerDuty, or custom Webhooks to fit into your existing incident response workflow.
Infrastructure and Data Sovereignty
Privacy isn't a marketing feature; it's a compliance requirement. For European companies, knowing exactly where your data is hosted matters for GDPR. You should evaluate whether your monitoring provider allows a choice between EU and US hosting. Many legacy incumbents default to US servers, which might conflict with your internal data sovereignty policies. A transparent provider will let you pin your monitoring nodes and data storage to specific regions. This ensures you meet regulatory standards without extra configuration. We built StatusPulse to give teams this exact control, offering dedicated EU or US hosting options from the start.
Programmable Selectors and Logic
Static monitoring is brittle. If you monitor a page that includes a dynamic timestamp in the header, a simple content change check will trigger a false positive every minute. You need support for regex or specific CSS selectors to isolate the elements that actually matter. This logic should extend to your backend. A robust stack monitors API endpoints and HTML pages side-by-side. Don't forget SSL certificate monitoring. Expired certificates are one of the most common causes of preventable downtime, yet they are often overlooked until the browser warning appears for your users. Your tool should track these expiry dates automatically.
Step-by-Step: Setting Up a Robust Monitoring Workflow
Setting up a monitoring workflow requires a strict prioritization of your critical paths. You don't need to monitor every static asset or documentation page. Instead, focus on the endpoints that define your business: the homepage, the checkout flow, and the login page. If these fail, your users can't interact with your service. Most professional web page monitoring tools allow you to group these monitors into a single dashboard. This provides high-level visibility for stakeholders while keeping technical logs focused on the metrics that impact revenue.
Once you've identified these paths, configure multi-region checks. This is the only way to differentiate between a local ISP hiccup in London and a total global outage. If a monitor fails in Frankfurt but succeeds in Paris, you likely have a regional peering issue rather than a broken application. Use this data to inform your status page updates. Don't forget to layer in SSL and domain expiry checks. These act as a secondary safety net for preventable infrastructure failures that can take your entire site offline for hours.
Baseline and Threshold Configuration
A healthy state isn't just about a 200 OK response. You need to define latency thresholds based on historical performance data. If your checkout page usually loads in 1.2 seconds, an alert should trigger at 3 seconds, even if the page is technically "up". This prevents performance degradation from going unnoticed by your team. Implement "retry" logic. Confirming a failure twice from different nodes before paging a developer prevents unnecessary midnight alerts caused by transient network blips. Using professional website uptime monitoring tools helps you establish a 99.9% availability baseline that accounts for scheduled maintenance and transient noise.
Advanced Monitoring Scenarios
Modern applications often hide critical functionality behind authentication. Monitoring these pages requires handling cookies and login headers securely. You should store your credentials in a secure environment rather than hard-coding them into the monitor configuration. This keeps your production environment safe while ensuring the login flow actually works for users. Your front-end is also only as reliable as the APIs it consumes. If your product grid relies on a third-party service, you need to track that dependency directly. Implementing synthetic API monitoring ensures your complex workflows remain functional across every update. This approach catches logic errors and payload changes that a simple HTML check would miss.
Managing Incident Noise and Alert Fatigue
Alert fatigue is the primary cause of missed critical incidents in DevOps. When your phone pings every five minutes for a transient network blip, you eventually start to ignore it. That is exactly when the real outage happens. Most legacy web page monitoring tools flood your inbox with individual alerts for every sub-monitor that fails. This fragmentation hides the signal in the noise and makes it difficult to prioritize your response during a crisis.
To fix this, you must implement flap detection. This logic ensures you only get paged when a failure is persistent. It ignores monitors that cycle rapidly between up and down states due to minor network jitter. You should also group related monitors. If your entire Frankfurt node goes down, your system should recognize the correlation. Instead of receiving 50 individual pings for every endpoint, you receive one incident notification with a high-level summary. This allows your team to focus on the root cause rather than managing a notification storm.
You can simplify your response workflow with AI-powered incident management that keeps your team focused on the fix rather than the noise.
Filtering Dynamic Content
Monitoring logic must be resilient to routine updates. Don't monitor things that change by design. You should exclude timestamps, rotating ads, or user-specific data from your content checks. Use specific CSS selectors to target stable elements like headers or checkout buttons. For pages with high graphical volatility, use visual "ignore regions." Shifting from pixel-perfect matching to structural DOM monitoring prevents false positives caused by minor CSS adjustments or font changes. This ensures your alerts trigger for broken functionality, not a new marketing banner.
AI-Powered Incident Management
AI should act as a technical assistant, not a replacement for human judgment. High-quality web page monitoring tools now use AI to draft incident summaries by analyzing the failure type and recent logs. This saves valuable time during the "golden hour" of an outage. The AI can also automate the initial impact assessment, determining if an outage is global or limited to a specific region. However, human agency remains a core virtue. AI should suggest the update or the impact summary, but a human must approve it before it appears on your public status page.
Scaling Your Stack: Monitoring as a Trust Signal
Monitoring is only half the battle. The other half is communicating the results to your users. When a service fails, the lack of information often creates more frustration than the technical outage itself. Public status pages transform your internal technical data into a clear signal of transparency and reliability. By showing your uptime history and active incident reports, you build long-term trust with your audience. It moves your team from a reactive posture to a proactive one.
Many teams start with self-hosted status pages on their own infrastructure. This is a technical anti-pattern. If your main cluster goes down, your status page often goes with it. You need a decoupled system hosted on independent infrastructure to remain visible when your primary site is unreachable. Professional web page monitoring tools should offer native integrations that bridge the gap between detection and communication. This ensures that when a monitor triggers, your status page can update or draft an incident report for your review without manual data entry.
Choosing a provider with flexible hosting is critical for data sovereignty. You should look for platforms that allow you to host your status infrastructure in either the EU or the US. This ensures your communication layer aligns with your primary monitoring nodes and regional regulatory requirements. It also guarantees that your status information remains accessible even if a specific regional backbone experiences a major failure.
Integrating Public Status Pages
Automation is the key to reducing manual overhead during a crisis. You should configure your monitors to push updates directly to your public page. This provides a single source of truth for your customers and significantly reduces support ticket volume. Instead of answering dozens of redundant emails, your team can focus on the technical fix. For more complex setups, you can read more on API monitoring for high availability to see how backend health impacts your public trust signals.
The StatusPulse Advantage
We built StatusPulse to eliminate the fragmentation found in legacy monitoring stacks. It combines uptime, API, and SSL monitoring with AI-driven incident management in one place. You don't have to glue together three different tools just to get a functional status page. Our pricing is transparent and ethical. We don't charge per-subscriber fees or hide behind complex corporate tiers. You get a reliable, straightforward tool built by specialists for specialists. You can explore StatusPulse for your monitoring stack and start building a more transparent relationship with your users today.
Building Resilient Monitoring Workflows for 2026
Professional monitoring requires moving beyond simple pings to verify the actual integrity of your front-end and APIs. By establishing multi-region baselines and implementing flap detection, you ensure that every alert represents a genuine incident worth your time. This technical rigor prevents alert fatigue while protecting your critical paths from silent failures that status codes alone cannot detect. It's the difference between knowing your server is on and knowing your customers can actually complete a purchase.
Selecting the right web page monitoring tools allows you to transform raw performance data into a public trust signal. This approach reduces support volume and keeps stakeholders informed without manual intervention during a crisis. It's about creating a system that assists your team rather than adding to their cognitive load during the high-pressure "golden hour" of an outage.
You can start monitoring your stack with StatusPulse to access transparent EU or US hosting options and AI-powered incident drafting. Our flat, honest pricing models are designed to scale with your architecture without the hidden bloat of per-subscriber fees. Reliability is a continuous process. Implementing these technical standards today protects your user experience and your engineering focus for the long term.
Frequently Asked Questions
What is the difference between uptime monitoring and web page change detection?
Uptime monitoring verifies that your server is reachable and responding to requests, primarily checking for HTTP 200 status codes. Change detection focuses on the integrity of the rendered page, tracking modifications to the DOM or visual layout. While uptime prevents total outages, change detection identifies failures where the site is technically up but the content is missing, corrupted, or visually broken for the end user.
How often should I monitor my web pages for changes?
You should align your check frequency with the business value and volatility of the page. Critical paths like checkout flows or login endpoints require 1-minute intervals to minimize the mean time to detection (MTTD). For static marketing pages or documentation, daily or hourly snapshots are usually sufficient. Balancing these frequencies helps you manage infrastructure costs while ensuring high-stakes endpoints remain functional and accurate.
Can web page monitoring tools detect silent failures?
Modern web page monitoring tools detect silent failures by using headless browsers to render JavaScript and verify specific DOM elements. A server might return a successful status code while the front-end remains a blank screen or is missing a functional checkout button. By configuring monitors to look for specific CSS selectors or text strings, you catch logic errors that standard uptime pings would otherwise miss.
Is it better to monitor from the EU or the US?
It is best to monitor from the specific regions where your users actually reside to capture accurate latency and peering data. If you operate globally, you should use both EU and US nodes to differentiate between regional ISP issues and total global outages. European companies often prioritize EU hosting to comply with strict data sovereignty and GDPR requirements, ensuring their monitoring logs remain within the region.
How do I reduce false positives in my web page monitoring?
You reduce false positives by implementing flap detection and excluding dynamic content from your integrity checks. Flap detection ensures you are only alerted if a failure persists across multiple retries from different geographic nodes. You should also use CSS selectors to ignore volatile elements like timestamps, rotating ads, or user-specific session data that frequently trigger unnecessary alerts during routine page updates.
Do I need a separate tool for SSL certificate monitoring?
You don't need a separate tool if you choose a platform that includes SSL certificate monitoring as a core feature. Consolidating your uptime, API, and SSL checks into a single dashboard reduces technical debt and prevents the expiry surprises that lead to preventable downtime. Managing these through one provider ensures that your certificates are tracked automatically alongside your general infrastructure health and performance metrics.
What are the benefits of integrating monitoring with a public status page?
Integrating your monitors with a public status page automates incident communication and significantly reduces support ticket volume. When a failure is detected, the status page provides a single source of truth for your users, keeping them informed without manual intervention. This transparency builds long-term customer trust and allows your engineering team to focus entirely on the technical fix rather than managing redundant user emails.


