
An open port is a poor indicator of a functional real-time connection. You can have a live port while your application logic is effectively dead. Most teams rely on basic uptime checks that fail to catch silent connection drops or proxy misconfigurations. To effectively Monitor WebSocket: connect/handshake/upgrade thresholds; ping/pong RTT; subprotocol + custom headers must be tracked together. It's about moving beyond simple connectivity to true observability. We've seen too many systems fail because they ignored the nuances of RFC 6455 or failed to account for the 30 second heartbeat requirement.
We know the frustration of latency spikes in ping/pong cycles that degrade the user experience without triggering a single alarm. This guide helps you master the technical thresholds of WebSocket monitoring to ensure your real-time applications never drop a frame. You'll learn to validate handshakes within the 50 to 350ms window, automate subprotocol checks, and integrate these metrics into a transparent public status page. We're stripping away the complexity to give you high-level technical precision without the corporate bloat or the hidden costs associated with legacy monitoring tools.
Key Takeaways
- Traditional uptime checks miss stateful failures. Learn why monitoring the full lifecycle from HTTP upgrade to binary stream is essential for real-time reliability.
- Identify bottlenecks by breaking down the handshake into three measurable phases. Set precise thresholds for TCP connection, TLS negotiation, and protocol upgrades.
- Master the technical requirements to Monitor WebSocket; connect/handshake/upgrade thresholds, ping/pong RTT, and subprotocol + custom headers are the pillars of real-time observability.
- Secure your connections by validating subprotocols and custom headers. Ensure your Bearer tokens and communication rules remain intact during every upgrade.
- Automate your incident response. Link your WebSocket health directly to a public status page to maintain trust through transparent communication.
Beyond the 200 OK: Why WebSocket Monitoring Requires a New Mental Model
HTTP monitoring is easy. You send a request. You get a 200 OK. You move on. WebSockets don't work that way. They are stateful systems that require a persistent connection. Once the initial handshake is complete, the WebSocket protocol shifts from a standard HTTP request into a bidirectional binary stream. This evolution creates a massive blind spot for traditional uptime tools. If your monitoring only checks if the port is open, you aren't actually monitoring your application. You're just checking the fence while the house is on fire.
To truly understand health, you must Monitor WebSocket — connect/handshake/upgrade thresholds; ping/pong RTT; subprotocol + custom headers. At StatusPulse, we view these connections as living systems rather than static endpoints. They have a distinct lifecycle. They start with a TCP connection, move through a TLS handshake, and finalize with a protocol upgrade. Monitoring must track every stage, from that first packet to the final Close frame. Anything less is just guesswork.
The Anatomy of a WebSocket Failure
Failure in real-time systems is often silent. Zombie connections occur when a client believes the socket is active, but the server has already dropped it. This happens frequently with misconfigured proxies. Many load balancers silently kill long-lived connections after an idle period without notifying either end. Performance also varies by infrastructure. WebSocket over HTTP/1.1 suffers from head-of-line blocking, which can stall your entire message queue. Newer standards like HTTP/2 and HTTP/3 offer improvements, but they introduce new complexities in how frames are interleaved. Your monitoring needs to see these nuances to be effective.
Defining "Up" for Real-Time Systems
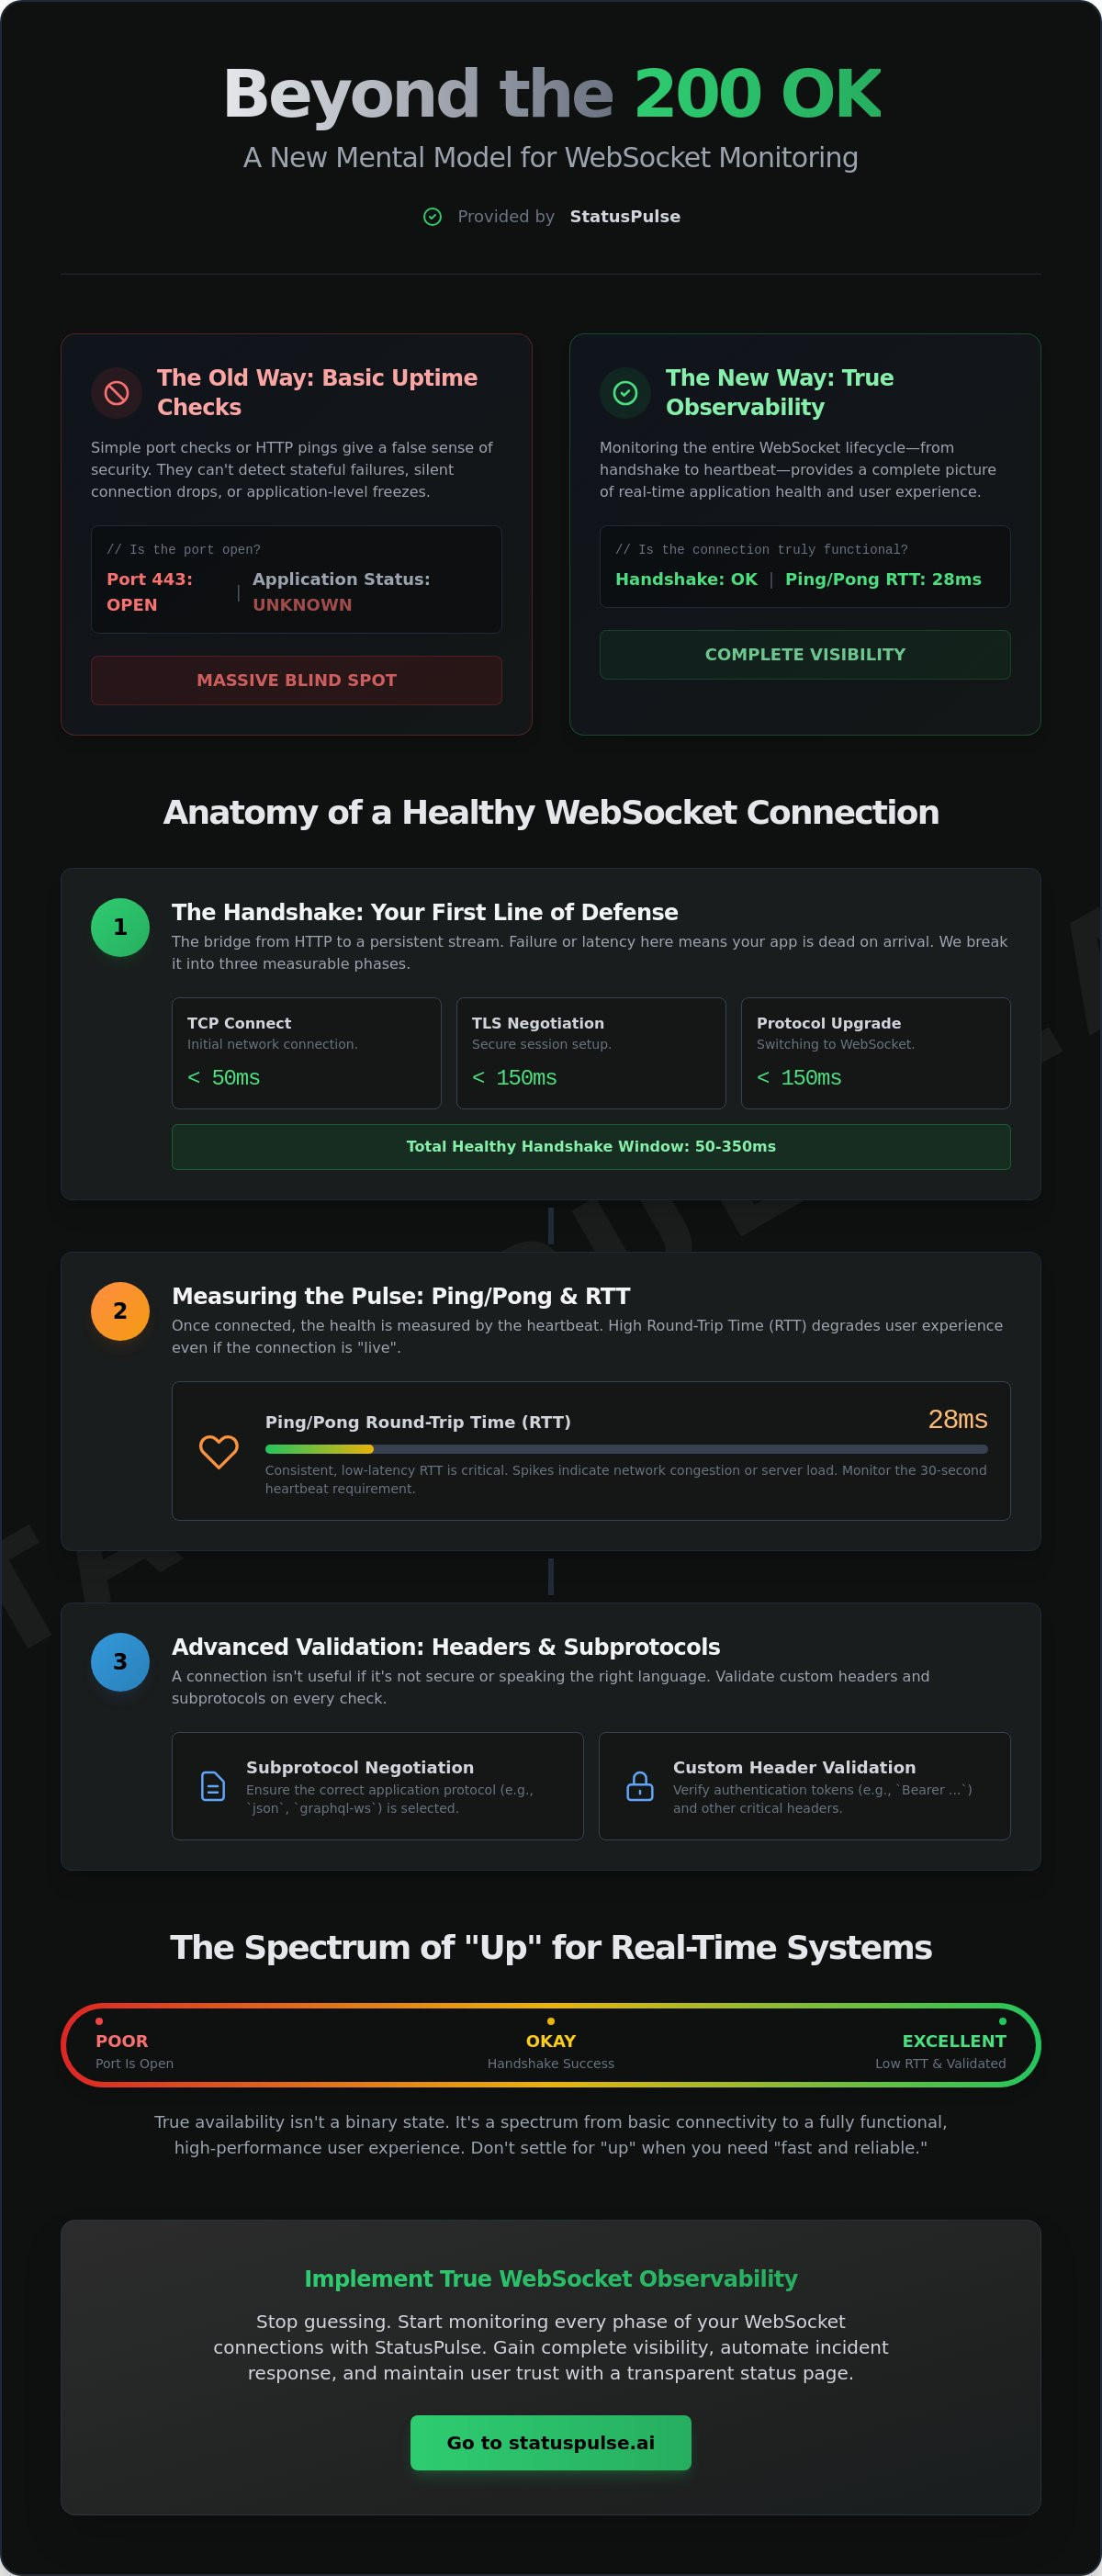
In a real-time environment, "up" is a spectrum. A reachable port is the bare minimum. True availability requires a successful handshake and the ability to negotiate the correct subprotocol. Speed is a critical factor here. If your handshake takes 2 seconds, your 99.9% uptime feels like 50% to the user. High latency during the upgrade phase often signals server-side resource exhaustion or poor geographic routing. We prioritize these metrics because they represent the actual user experience. Reliability isn't just about being there. It's about being fast enough to matter. If the handshake fails to negotiate the correct subprotocol, the connection is effectively down, regardless of what your port scanner says.
Mastering the Handshake: Thresholds for Connect, Upgrade, and Negotiation
The handshake is the most vulnerable moment for any WebSocket connection. It is the bridge between a standard web request and a persistent stream. If this phase fails or lags, your real-time application is dead on arrival. Many teams overlook the handshake because it happens so fast, but a "slow-burn" outage often starts here. When you Monitor WebSocket — connect/handshake/upgrade thresholds; ping/pong RTT; subprotocol + custom headers, you gain the ability to see these failures before they impact your users. We don't believe in vague health scores. We believe in precise, actionable data.
According to the official WebSocket standard (RFC 6455), the handshake must be a valid HTTP/1.1 GET request with specific upgrade headers. Monitoring this process requires breaking it down into three distinct phases: TCP connection, TLS negotiation, and the protocol upgrade. Each phase has its own failure modes and performance requirements. If you aren't measuring these separately, you're missing half the story. Setting aggressive thresholds for these phases prevents minor latency from turning into a total service collapse.
Establishing Connection Thresholds
Precision matters. Your monitoring should target specific latency windows for each phase of the connection. For the initial TCP Connect, aim for less than 50ms for local regions. Global traffic should stay under 150ms to ensure a snappy experience. The TLS Handshake is often slowed down by long certificate chains or lack of ALPN support. Keep your cert chains lean to minimize round trips. Finally, measure the Upgrade Latency. This is the time from the initial "GET" request to the "101 Switching Protocols" response. Ideally, this should happen in a single round trip after the TLS handshake is complete.
Common Handshake Pitfalls
Misconfigured headers are the primary cause of handshake failure. Missing or incorrect "Origin" headers often lead to silent rejections in strict production environments. You might see 403 Forbidden or 426 Upgrade Required errors if your proxy isn't configured to pass the "Connection" and "Upgrade" headers correctly. Another common issue is the improper handling of the Sec-WebSocket-Accept response header. If the server doesn't return the correct hashed key, the client will drop the connection immediately. StatusPulse automates the detection of handshake degradation, alerting you the moment your upgrade success rate dips or your latency spikes. This level of detail ensures you spend less time debugging and more time building.
Measuring the Pulse: Ping/Pong RTT and Latency Sustainability
Once the handshake is finalized, the real work begins. A successful connection is only valuable if it stays responsive over time. Most legacy tools stop looking after the first 101 Switching Protocols response. This is a mistake. To effectively Monitor WebSocket — connect/handshake/upgrade thresholds; ping/pong RTT; subprotocol + custom headers must be observed continuously. Ping and Pong frames act as the protocol's heartbeat. They ensure the line is still open and the application is still processing data. Without this pulse, you're flying blind.
RTT (Round Trip Time) is your early warning system. It reveals network congestion or server-side lag before the connection actually drops. When implementing WebSocket servers, developers often treat these control frames as an afterthought. They shouldn't. Monitoring RTT trends helps you predict capacity issues in your backend. If your heartbeat latency starts to climb, your server is likely struggling to manage its concurrent connection pool. High RTT in WebSockets is more damaging than in standard REST APIs because it delays every subsequent message in the stream.
Calculating WebSocket RTT
There's a critical difference between network-level ICMP pings and protocol-level WebSocket pings. A network ping only tells you the server is reachable. A WebSocket ping proves the application logic is still responsive. Ping/Pong RTT is the time between a client sending a Ping frame and receiving a corresponding Pong frame. Measuring this specific interval allows you to isolate application performance from general network health. It's the only way to know if your socket is truly healthy or just technically connected.
Setting Heartbeat Intervals
A 30 second heartbeat is the industry standard for a reason. It balances network overhead with detection speed. Frequent heartbeats prevent intermediate proxies from closing idle connections. Many load balancers silently kill long-lived sockets after 60 seconds of inactivity. Regular traffic keeps these paths open. This also helps detect "half-open" connections where one side stops receiving data but doesn't send a close frame. Integrating RTT metrics into your uptime monitoring strategy allows you to see trouble before it causes a disconnect. We believe in simple, transparent data that shows the truth of your system's performance. Don't wait for a user to report a frozen UI. Watch the pulse instead.
Advanced Validation: Subprotocols and Custom Headers
Connectivity is only half the battle. A WebSocket connection can be technically "up" while the application logic is completely broken. This happens when the communication rules aren't properly negotiated. To truly Monitor WebSocket — connect/handshake/upgrade thresholds; ping/pong RTT; subprotocol + custom headers must be validated as part of a single health check. Without these checks, you risk shadow failures where users see a connected icon but receive no data. We value precision over surface-level metrics.
Subprotocols define the language your application speaks. Whether you use JSON, GraphQL-WS, or Protobuf, the handshake must finalize this choice. If the server fails to select a protocol, it often defaults to a "null" state. The socket remains open, but the messages become gibberish to the client. This is a silent killer for real-time apps. It's why we advocate for deep validation of the handshake response. You need to know exactly which protocol was selected before the first binary frame is sent.
Validating Subprotocol Negotiation
Multi-version support is common in evolving APIs. Your monitoring should test the Sec-WebSocket-Protocol header by requesting multiple versions and verifying the server's choice. If your server picks an outdated or unsupported protocol, your frontend will crash. Integrating these checks into your API monitoring workflow is the best way to catch regressions. It moves your observability from simple uptime to functional integrity. We don't believe in "good enough" monitoring. We believe in getting it right.
Custom Header Integrity
Security and routing rely on custom headers during the upgrade phase. Bearer tokens are essential for authenticating the initial GET request. In distributed systems, headers also carry tenant IDs or specific routing instructions for load balancers. These are often the first things to break when you update a CDN or WAF. Intermediaries often strip headers they don't recognize. If your auth header vanishes, the server rejects the upgrade. Monitoring for the presence and correctness of these headers ensures your security layer isn't accidentally blocking your own traffic. It is a simple step that prevents massive headaches.
Don't settle for tools that treat WebSockets like standard web pages. You need a principled approach that understands the nuances of the upgrade process. Protect your real-time infrastructure with StatusPulse.
Implementing WebSocket Observability with StatusPulse
Monitoring shouldn't feel like a second job. Most enterprise tools bury WebSocket metrics under layers of complex menus and proprietary scripts. We take a different path. StatusPulse provides a lightweight, principled approach to observability. We focus on the data that actually matters for your real-time performance. Our philosophy is simple. Tools should assist human agency, not replace it with automated bloat. By choosing a focused team over a faceless corporation, you get precision without the unnecessary overhead.
Effective monitoring requires a unified view of the connection lifecycle. To properly Monitor WebSocket — connect/handshake/upgrade thresholds; ping/pong RTT; subprotocol + custom headers, your platform must treat these variables as a single health signature. StatusPulse does exactly this. We don't just alert you when a port closes. We alert you when your handshake latency drifts or your subprotocol negotiation fails. This level of detail ensures your real-time applications never drop a frame due to silent infrastructure degradation.
Zero-Bloat Setup
You can configure your first WebSocket check in under 60 seconds. Our interface is designed for specialists who value their time. You define your specific thresholds for Connect, Handshake, and RTT in a single, intuitive view. No complex scripting required. Once configured, you can link your monitoring directly to your public status page. This automation ensures that your customers are the first to know when a service is degraded, not the last. Transparency is the foundation of trust.
From Outage to Communication
Technical metrics often fail to translate to the end user. When a WebSocket RTT spike occurs, your customers just see a spinning loader. StatusPulse uses AI incident management to bridge this gap. Our system summarizes complex technical failures into clear, honest incident reports for non-technical users. This reduces support volume and keeps your team focused on the fix. It is about moving from panic to controlled communication. We believe in providing a calm, reassuring experience during technical disruptions.
Our commitment to integrity extends to where we host your data. StatusPulse is built on EU-based infrastructure, adhering to the world's strictest privacy standards. We don't hide behind complex pricing models or corporate jargon. We offer a fair, ethical alternative for teams that prioritize reliability and technical precision. Join the rebellious streak against corporate bloat. Experience a monitoring tool that is as streamlined as the software you build.
Secure Your Real-Time Future
Real-time applications demand a higher standard of observability. A simple "up" status doesn't account for handshake latency or zombie connections. You've learned how to track every phase of the lifecycle from TCP connect to subprotocol negotiation. To truly Monitor WebSocket — connect/handshake/upgrade thresholds; ping/pong RTT; subprotocol + custom headers are the metrics that define your success. These aren't just numbers. They are the difference between a seamless user experience and a frozen interface.
StatusPulse offers a principled alternative to bloated enterprise monitoring. We provide AI-powered incident summaries that explain technical spikes to your users in plain language. Our EU-based hosting ensures your data stays private and precise. No corporate bloat. No complex pricing models. Just honest tools built by specialists for specialists. Start Monitoring WebSockets for Free with StatusPulse today. Take control of your infrastructure with quiet confidence. Your users deserve nothing less than total transparency.
Frequently Asked Questions
What is the difference between WebSocket monitoring and a standard HTTP check?
WebSocket monitoring validates the entire persistent connection lifecycle, while HTTP checks only confirm a single request-response cycle. To effectively Monitor WebSocket — connect/handshake/upgrade thresholds; ping/pong RTT; subprotocol + custom headers must be measured continuously. A standard HTTP check misses "zombie" connections where the port remains open but the application logic has failed. We prioritize tracking the binary stream, not just the initial response.
How often should I send a Ping frame to monitor WebSocket health?
Send a Ping frame every 30 seconds to maintain connection health and prevent idle timeouts. This frequency balances network overhead with the need for rapid failure detection. Most modern load balancers and proxies expect regular traffic to keep a socket open. If you wait longer, you risk silent drops that frustrate your users. We recommend a 30-second heartbeat as a principled baseline for most real-time systems.
Can I monitor WebSockets that require authentication headers?
Yes, you can monitor WebSockets that require custom authentication headers like Bearer tokens. The initial handshake is a standard GET request where these headers are passed to the server. Validating their presence ensures that your security layer isn't accidentally blocking legitimate traffic. StatusPulse allows you to configure these headers easily. This ensures your monitoring reflects the actual client experience in your production environment.
What are the ideal thresholds for a WebSocket handshake in 2026?
Ideal handshake thresholds in 2026 range from 50ms to 350ms depending on geographic routing. This window includes DNS resolution, the TCP handshake, and the TLS negotiation. Any upgrade taking longer than 500ms usually indicates server-side resource exhaustion or a misconfigured proxy. We focus on these precise windows to help you identify "slow-burn" outages before they lead to a total service collapse.
How does WebSocket monitoring over HTTP/2 differ from HTTP/1.1?
WebSocket over HTTP/2 uses a single stream within a multiplexed connection, while HTTP/1.1 requires a dedicated TCP connection for each socket. Monitoring HTTP/2 requires tracking stream-level health and potential head-of-line blocking issues. While HTTP/2 is more efficient, it adds complexity to how you measure individual frame latency. We ensure your observability covers both standards with high-level technical precision and zero fluff.
Why does my WebSocket connection drop after 60 seconds of inactivity?
Connections often drop after 60 seconds because of idle timeouts on intermediate proxies or load balancers. These intermediaries kill long-lived sockets to save resources if they don't see active traffic. Implementing a 30-second heartbeat prevents this by signaling that the connection is still active. It's a common configuration issue that simple uptime checks fail to catch, making persistent, state-aware monitoring essential for your infrastructure.
How can I display WebSocket uptime on a public status page?
You can display WebSocket health by linking your monitoring checks directly to a public status page. StatusPulse automates this transition. When a handshake failure or high RTT is detected, the status page updates instantly to inform your users. This transparency builds trust and reduces the burden on your support team during technical disruptions. It's about clear, honest communication that respects your user's time.
Does StatusPulse support custom subprotocol validation?
StatusPulse fully supports custom subprotocol validation during the upgrade phase. You can specify the expected subprotocol, such as JSON or GraphQL-WS, and our system verifies that the server negotiates it correctly. This prevents "null" subprotocol traps where the connection is technically open but the application can't communicate. We value the functional integrity of your real-time streams, not just the basic port status.


