
A green light on your dashboard is a lie if your service is dead inside. In 2026, relying on basic TCP pings to monitor gRPC health; grpc.health.v1.Health/Check; per-service probing; mTLS; optional Watch streaming; is a liability that leads to silent failures. A server can easily accept a connection while its underlying logic is broken. You need protocol-native visibility to stop guessing and start knowing.
We agree that configuring mTLS and complex probes shouldn't be a source of constant stress. This guide teaches you how to implement the standard health check protocol for 2026-ready reliability. We'll cover how to handle secure probing, per-service granularity, and streaming updates from gRPC Core v1.80.0 to ensure your uptime monitoring and public status pages reflect reality. By the end, you'll have the tools to maintain zero-downtime deployments without the usual configuration bloat.
Key Takeaways
- Stop relying on TCP port checks. They ignore service logic and hide internal failures that protocol-aware probing reveals.
- Master how to monitor gRPC health — grpc.health.v1.Health/Check; per-service probing; mTLS; optional Watch streaming to achieve precise status reporting.
- Secure your monitoring traffic with mTLS. Learn to configure certificates for probes to maintain a zero-trust architecture without adding complexity.
- Reduce your time to detect outages by using the Watch method. Streaming updates provide real-time visibility that traditional polling cannot match.
- Connect your backend signals to StatusPulse. Automate your public status pages and incident management to build lasting trust through transparency.
The gRPC Visibility Gap: Why TCP Probes Aren’t Enough
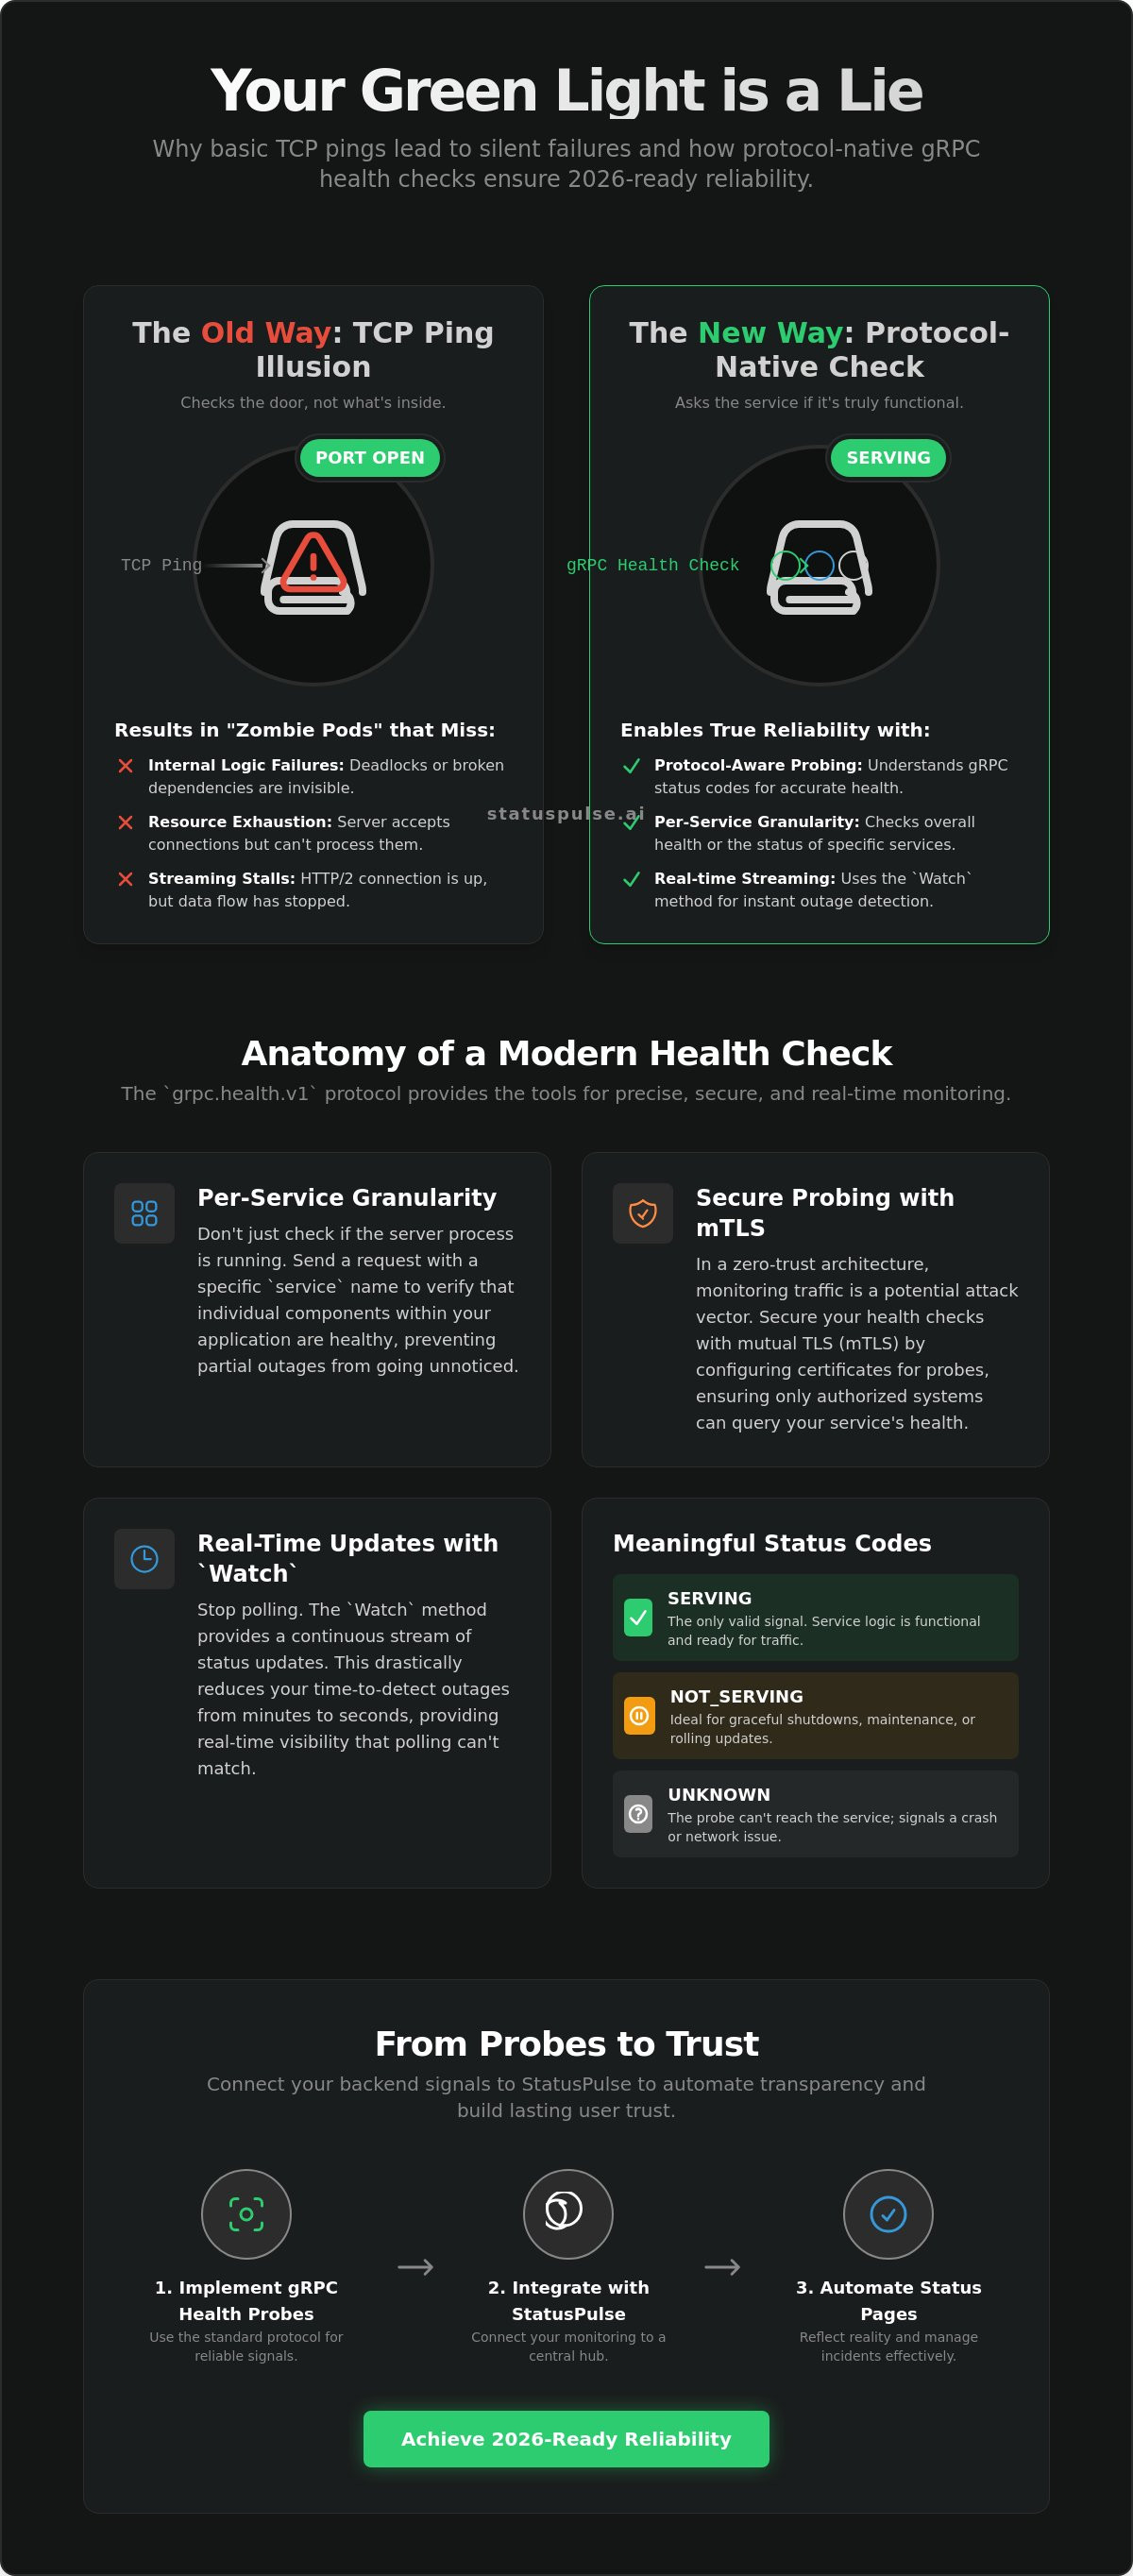
A port is just a door. Knowing the door is open doesn't tell you if the host is alive, conscious, or capable of working. Traditional uptime monitoring often relies on TCP pings to verify service availability. This is a blunt instrument. In a modern microservices environment, a successful TCP handshake is a low bar that hides deep architectural failures. To effectively monitor gRPC health — grpc.health.v1.Health/Check; per-service probing; mTLS; optional Watch streaming; you must move beyond the transport layer and into the protocol itself.
When you rely on basic port checks, you risk creating "zombie pods." These are instances in a Kubernetes cluster that pass liveness checks because the port is technically open, yet they fail to process actual gRPC requests. The application logic might be deadlocked, or a required backend dependency might be unreachable. If your monitor doesn't understand the service state, your load balancer will continue to send traffic to a black hole. For 2026-ready reliability, 99.99% availability requires protocol-native probing that understands the difference between a listener and a functional handler.
HTTP/2 vs. HTTP/1.1 Monitoring Realities
The transition to HTTP/2 changed the rules of the game. Unlike HTTP/1.1, which often opens and closes connections, gRPC utilizes long-lived streams. These connections stay active even when the service logic is degraded. Multiplexing allows multiple calls over a single connection, which complicates things for simple monitors. A traditional HEAD request can't see through the multiplexed layers. Connection pooling further masks issues; a client might hold a "healthy" connection to a server that is internally exhausted and unable to spawn new handlers. This makes uptime monitoring at the protocol level essential for transparency.
Common gRPC Failure Modes to Watch
Service failures in gRPC are rarely binary. They are often subtle and specific. You need to watch for these distinct patterns:
- Silent streaming stalls: The connection remains up, but the data flow stops without an explicit error code.
- Resource exhaustion: The server returns a
RESOURCE_EXHAUSTEDstatus. This is a logic failure that a TCP probe will never catch. - Stale DNS bindings: Clients may stick to old IP addresses after a deployment, leading to traffic imbalances that port-level monitors ignore.
Industry incumbents often hide these complexities behind expensive, bloated platforms. We prefer a different path. Precision matters more than flashiness. By implementing the grpc.health.v1 standard, you gain the granular insight needed to distinguish between a minor hiccup and a total service collapse. This transparency is the only way to build a reliable status page that your users actually trust.
Implementing the grpc.health.v1.Health/Check Protocol
The standard gRPC health check isn't a complex secret. It's a simple Unary RPC defined by the grpc.health.v1 service. By implementing this, you allow external tools to Monitor gRPC health — grpc.health.v1.Health/Check; per-service probing; mTLS; optional Watch streaming. This protocol provides a consistent way for your infrastructure to ask: "Are you ready for traffic?" The official gRPC Health Checking Protocol specification removes the guesswork from this process. It defines exactly how servers should report their status to ensure compatibility across different languages and platforms.
The SERVING state is your primary signal. It tells your load balancer that the service logic is functional and ready. NOT_SERVING is equally valuable. It allows you to signal maintenance or a graceful shutdown without abruptly dropping active HTTP/2 streams. This state is perfect for rolling updates where you want to drain traffic from a pod before killing it. If the health service itself is unreachable, the monitor reports UNKNOWN. This is usually a sign of a network partition or a total process crash. Precise reporting here prevents traffic from hitting the "zombie" instances that plague poorly monitored clusters.
The Anatomy of a Health/Check Request
The request includes a service string parameter. You can leave it empty to check the overall server health. Or, you can provide a specific service name for granular, per-service probing. This is a massive upgrade over legacy systems that only look at the process. The response uses a standard HealthCheckResponse message containing the status enum. The SERVING state is the only valid signal for traffic readiness. Using these standard messages means you don't have to reinvent the wheel for every new microservice you deploy. It keeps your architecture clean and your API monitoring straightforward.
Enabling the Health Service in Your Language
Most languages have native support. In Go, you import google.golang.org/grpc/health. In Java, use grpc-services. These libraries make setup fast and reliable. You should expose the health port carefully. Many teams keep it on a separate internal port to avoid exposing metrics to the public internet. Map your internal metrics like database connectivity, cache availability, or memory usage directly to these gRPC states. This ensures your setup can effectively Monitor gRPC health — grpc.health.v1.Health/Check; per-service probing; mTLS; optional Watch streaming. By tying your backend logic to the health service, you ensure that your status signals reflect reality rather than just a running process.
MTLS and Per-Service Probing: Securing Your Health Checks
Security isn't an afterthought. In a zero-trust mesh, every request must be authenticated. Health checks are no exception. An anonymous health probe is a vulnerability. You need to Monitor gRPC health — grpc.health.v1.Health/Check; per-service probing; mTLS; optional Watch streaming; while ensuring that only authorized agents can query your server's internal state. Trusting a probe just because it's on your network is a legacy mistake that leads to lateral movement during a breach.
Configuring mutual TLS (mTLS) for external monitoring requires your agent to have its own identity. This means the probe presents a client certificate that your gRPC server verifies. Without this, you're either leaving your health endpoint wide open or blocking your own visibility. Many industry incumbents make certificate management feel like a dark art. It shouldn't be. We believe in straightforward security that protects your data without the corporate bloat.
Setting Up mTLS for External Probes
Generating client certificates is the first step. Your monitoring agent must present a valid cert that your gRPC server trusts. Use the Subject Alternative Name (SAN) to define the agent's identity. This allows the server to verify that the probe is legitimate before responding. Automation is vital here. If you don't automate certificate rotation, your monitoring will eventually cause the very outage it's supposed to detect. It's a common failure mode that a simple, ethical approach to infrastructure can avoid.
Granular Probing with Service Names
Large gRPC servers often host multiple services within a single binary. Probing the entire node is lazy. It's also dangerous. If your "Order" service is down but your "Inventory" service is up, a generic health check might still return SERVING. This hides the failure from your status page. Per-service probing allows you to query specific logic. You can isolate a failure in one module without killing the entire instance. This granularity is essential for complex uptime monitoring.
When implementing health-checking gRPC on Kubernetes, this precision ensures that traffic only flows to functional components. Managing dependencies is a choice. Should Service A be healthy if its database is down? Probably not. Use service names to create a hierarchy of health that reflects your actual business logic. This reduces alert noise and ensures your public status reflects the truth. By focusing on precision over generic signals, you build a system that is as reliable as it is transparent.
Real-Time Observability: Using Watch Streaming and Status Codes
Polling is a relic of slower times. If your monitor checks every 30 seconds, you can miss a critical failure for 29 of them. That's a massive visibility gap. You need to Monitor gRPC health — grpc.health.v1.Health/Check; per-service probing; mTLS; optional Watch streaming; to ensure your data is always current. Unary checks are fine for basic liveness. They're simple. But for high-stakes environments, they lack the urgency required to maintain 99.99% availability.
Streaming updates change the narrative. Instead of asking "Are you okay?" repeatedly, the server tells you the moment things change. This shift from pull to push is essential for modern observability. It empowers your team to act before a minor hiccup becomes a front-page outage. We value this type of precision. It's the difference between a reactive mess and a controlled, ethical response to technical debt.
The Watch RPC for Instant Failure Detection
The Watch method provides a persistent stream of health states. It eliminates the latency inherent in traditional polling cycles. When a service moves from SERVING to NOT_SERVING, the update is pushed to your monitor immediately. This reduces your time to detect (TTD) from minutes to milliseconds. Your monitor must be resilient. It needs to handle stream reconnections gracefully without losing visibility. Integrating these streams into your AI incident management pipeline ensures that your response team is never the last to know.
Decoding gRPC Status Codes in Monitoring
A binary "up" or "down" signal is too simple for complex systems. gRPC provides 16 standard status codes that offer deep context. UNAVAILABLE signals that the server is overloaded or the service is temporarily down. UNIMPLEMENTED usually points to a configuration error or an incorrect service name in your probe. UNAVAILABLE is the most critical code for uptime monitoring because it signals a direct impact on user experience.
Tracking the distribution of these codes per method reveals hidden bottlenecks. If you see a spike in DEADLINE_EXCEEDED, your health check is timing out. This often happens when the server is struggling under load but hasn't crashed yet. Setting aggressive deadlines for your probes ensures your monitoring doesn't hang while waiting for a dying process. This level of detail is exactly why we built uptime monitoring for specialists who demand truth over generic pings.
From Probes to Trust: Integrating gRPC with StatusPulse
Technical signals are just data points until they reach a human. You can have the most sophisticated protocol-aware probes in the world, but if your users are staring at a spinning wheel while your internal dashboard stays green, you've failed. Trust is built on the bridge between backend reality and public transparency. To truly Monitor gRPC health — grpc.health.v1.Health/Check; per-service probing; mTLS; optional Watch streaming; you must ensure that your technical health translates into clear, honest communication.
We see a recurring problem in the industry. Large corporate providers offer "black box" monitoring that prioritizes optics over truth. We don't. We believe that a failed Health/Check is an opportunity to prove your reliability through transparency. By moving from isolated probes to an integrated incident culture, you reduce customer churn and eliminate the stress of manual status updates during a crisis. It's a straightforward approach for teams that value integrity over flashiness.
Automating Status Updates with AI
During an active outage, your DevOps team shouldn't be wasting time drafting copy for a status page. They should be fixing the service. StatusPulse automates this transition. By listening to your gRPC failure signals, our AI incident management can draft incident reports directly from your logs. This isn't about replacing human judgment; it's about providing an assistant that handles the repetitive work. This integration works seamlessly with your broader API monitoring strategy to ensure no failure goes unnoticed or uncommunicated.
Building a Transparent Incident Culture
Honesty is a competitive advantage. Linking your internal gRPC health checks to a public status page signals to your users that you have nothing to hide. When a specific service name fails in a per-service probe, StatusPulse can reflect that exact degradation on your page automatically. This level of granularity prevents the "all or nothing" panic that generic monitors cause. It allows your users to see that while one feature might be down, the rest of your platform remains functional.
Choosing an ethical alternative to bloated enterprise software means choosing precision. You've learned how to secure your probes with mTLS and reduce latency with Watch streaming. Now, it's time to put that data to work. Don't let your gRPC signals die in a silo. Use them to build a foundation of trust with every user you serve. Start monitoring your gRPC services with StatusPulse today. It's the most logical step toward a more reliable, 2026-ready infrastructure.
Achieve Protocol-Native Reliability
Relying on legacy port checks is a gamble you don't need to take. By adopting the standard protocol, you ensure your monitoring reflects the actual state of your service logic. You've learned how to secure these probes with mTLS and leverage streaming for near-instant failure detection. These aren't just technical upgrades. They are the building blocks of a transparent, ethical relationship with your users. True observability requires looking past the transport layer and into the heart of your handlers.
Precision matters. To effectively Monitor gRPC health — grpc.health.v1.Health/Check; per-service probing; mTLS; optional Watch streaming; you need a partner that values truth over corporate bloat. StatusPulse offers native gRPC and API monitoring support with EU-based privacy and compliance at its core. Our AI-powered incident drafting reduces the stress of manual communication. This allows your team to focus on resolution while we handle the transparency and public updates.
Take the first step toward a more resilient architecture today. Monitor your gRPC services for free with StatusPulse. It's time to replace silent failures with actionable, real-time insights. Build something reliable. Build something your users can trust.
Frequently Asked Questions
What is the difference between grpc.health.v1.Health/Check and Watch?
Check is a Unary RPC used for one-time polling. It is the standard choice for periodic liveness checks. Watch is a streaming RPC that provides real-time updates. It pushes status changes to the client as they happen. Use Check for simple monitoring tasks. Use Watch when you need to reduce the time to detect a critical failure to milliseconds.
How do I monitor a gRPC service that requires mTLS?
Your monitoring agent must present a valid client certificate to the server. The gRPC server validates this certificate against its internal trust chain before responding. This is the only way to Monitor gRPC health — grpc.health.v1.Health/Check; per-service probing; mTLS; optional Watch streaming; while maintaining a zero-trust architecture. It ensures that only authorized probes can access your service's internal state.
Can I use a standard HTTP/1.1 load balancer to monitor gRPC health?
Usually not. gRPC relies on HTTP/2 features like trailers and specific framing that HTTP/1.1 does not support. A legacy load balancer will fail to parse the gRPC response correctly. You need a modern balancer that supports HTTP/2 pass-through or native gRPC termination. This ensures your health signals aren't lost in translation between protocol versions.
What gRPC status codes indicate a service is unhealthy?
The UNAVAILABLE status code is the primary indicator of a service failure. It signals that the server is overloaded or the handler is down. DEADLINE_EXCEEDED is another critical signal. It suggests the server is struggling to respond within the required window. Monitoring these codes provides much more context than a simple binary up or down signal from a basic port check.
How does per-service probing work in a multi-service gRPC server?
To Monitor gRPC health — grpc.health.v1.Health/Check; per-service probing; mTLS; optional Watch streaming; you populate the service field in your request. The server then evaluates the readiness of that specific module. If you leave the field empty, the server reports its overall health. This granularity allows you to report a failure for one service while keeping others active on your status page.
Why does gRPC need a specialized health check protocol instead of TCP?
TCP is a blunt instrument. It only confirms that the network port is open. It cannot see if your application is deadlocked or if its database connection has failed. The gRPC health protocol provides application-level visibility. It asks the service itself if it is functional. This prevents traffic from hitting zombie instances that are technically reachable but logically dead.
Is there a performance overhead to implementing the gRPC health service?
The overhead is negligible. The health service is a lightweight RPC designed for speed. It usually checks simple in-memory flags or atomic variables rather than performing heavy calculations. It is a small trade-off for the massive gain in observability. Implementing it ensures that your monitoring stays as efficient as the rest of your high-performance gRPC architecture.
How do I integrate gRPC health checks with a public status page?
Connect your monitoring agent to a platform like StatusPulse. When a probe detects a failure, the system can automatically update your public status page. It can even use AI to draft incident reports based on the specific gRPC status codes received. This bridges the gap between backend technical signals and honest, transparent communication with your users.


