
Unplanned downtime costs the Global 2000 roughly $400 billion every year. That is about 9% of their total profits. For many teams, the most dangerous outages aren't the loud ones. They are the silent failures that happen when a background task simply stops. You assume your backups are running. You think your reports are generating. Then, weeks later, you realize the cron job died in silence. It's a stressful, unnecessary way to manage infrastructure.
We agree that bloated monitoring tools and complex pricing shouldn't be the tax you pay for peace of mind. You deserve a reliable way to Monitor Heartbeat (cron / push); inverse polling; schedule + grace; payload capture; silent-failure detection. This article will teach you how to master background job monitoring to eliminate silent failures forever. We'll explore how to set up smart grace periods, capture critical payloads, and move toward a state of zero silent failures with automated reporting and clear visibility into your task health.
Key Takeaways
- Stop relying on silent logs. Learn to distinguish between a running server and a failing background process.
- Adopt inverse polling. Let your scripts push health data to your monitor for more reliable failure detection.
- Configure your Monitor Heartbeat (cron / push); inverse polling; schedule + grace; payload capture; silent-failure detection to secure your infrastructure.
- Capture stderr in your heartbeat requests. This allows you to debug failing tasks instantly without logging into remote servers.
- Automate your incident reporting. Link heartbeat health to your public status pages for real-time transparency with your users.
The Peril of Silent Failures in Background Jobs
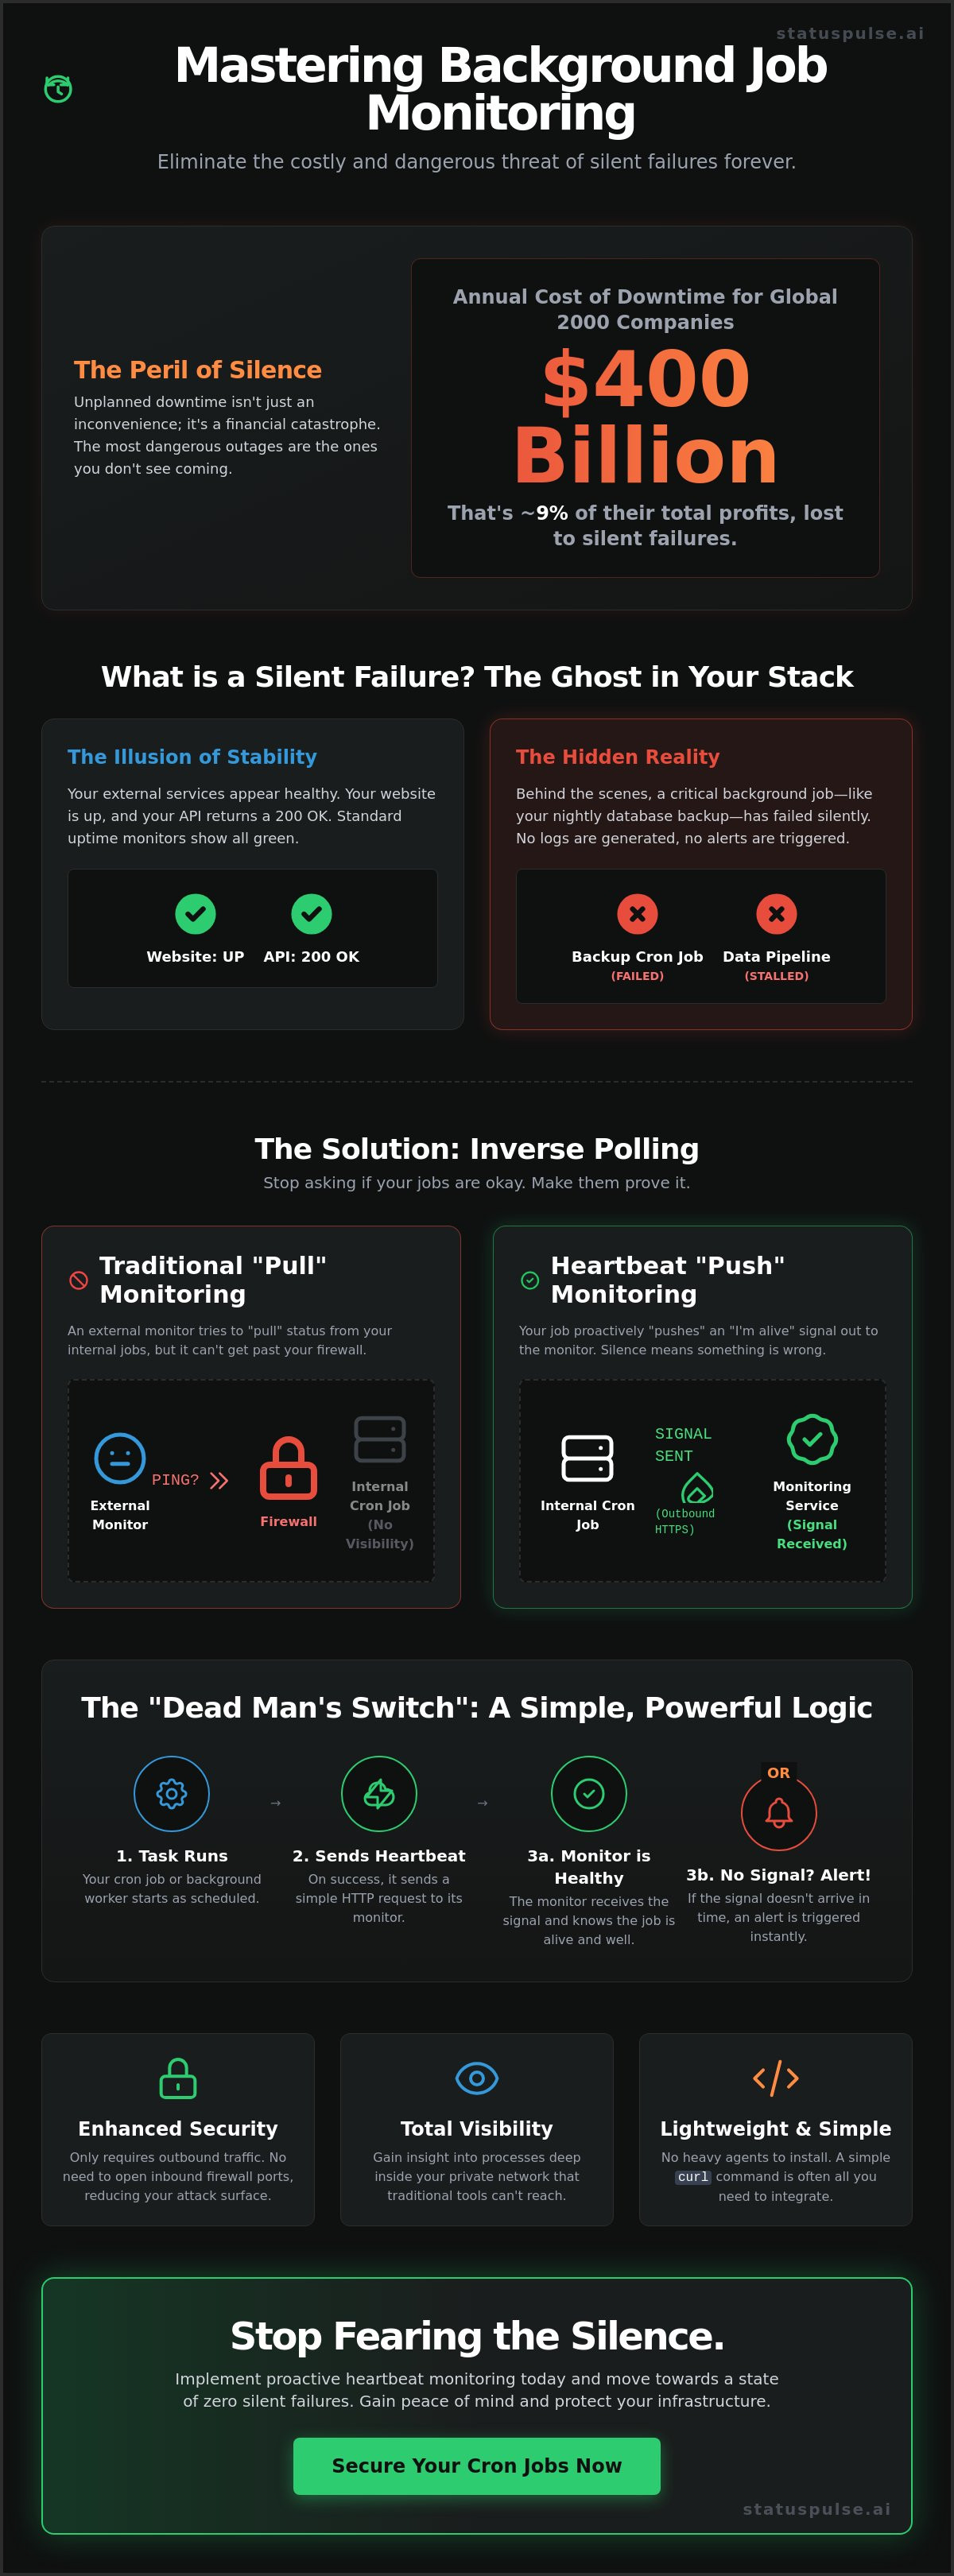
A silent failure is the most dangerous event in your stack. It's a ghost. It happens when a process stops without triggering a single alert. Your website stays up. Your API returns a 200 OK. But behind the scenes, your database optimization script has crashed. You don't know it yet. Nobody notices. This is the "illusion of stability" that keeps engineers awake at night. It's the gap between what you see and what is actually happening.
Consider the classic nightly backup horror story. A developer sets up a cron job to dump the database to an S3 bucket every midnight. For months, the system logs show the server is healthy. Then, a disaster strikes. The team tries to restore the data, only to find the last successful backup was three months ago. A simple permissions change broke the script. Because the server stayed online, the uptime monitor stayed green. This is exactly why you need to Monitor Heartbeat (cron / push); inverse polling; schedule + grace; payload capture; silent-failure detection.
Traditional polling methods, like simple HTTP pings, cannot see inside your private network. They can't check the health of a local script. They are external observers. To truly understand background health, you need a Heartbeat (computing) signal that originates from within the task itself. Without it, the business cost is high. You face corrupted data pipelines, lost revenue, and a total erosion of customer trust. Silence isn't safety. It's a liability.
Why Cron is Not a Monitoring Solution
Cron is a scheduler. It isn't an observer. It excels at starting tasks but fails miserably at reporting their outcomes. Most default configurations ignore exit codes. If a script returns a non-zero status, cron simply moves on. Environment mismatches are also common. A script that runs perfectly in your terminal often fails in production because of missing PATH variables. Cron won't tell you why. It just stays quiet.
The Limitations of Log-Based Alerting
Relying on logs for alerting is a reactive strategy. Logs require ingestion, expensive storage, and complex parsing rules. The biggest flaw? Missing logs are nearly impossible to detect. If a job never starts, it never generates a log entry. In systems architecture, the "no news is good news" fallacy leads to disaster. You need a proactive system like StatusPulse that expects a signal and alerts you when it fails to arrive.
Understanding Heartbeat Monitoring as Inverse Polling
Most monitoring systems operate on a "pull" basis. They reach out from a central server to your public endpoint and ask if everything is functioning. While this works for websites, it fails for internal processes. If your server is behind a strict firewall or running a private cron job, an external probe cannot reach it. Inverse polling flips this relationship. Instead of the monitor asking for status, the service pushes its own health data to the monitor. This proactive signal is the foundation of how you Monitor Heartbeat (cron / push); inverse polling; schedule + grace; payload capture; silent-failure detection.
The architecture consists of two main components: the Client and the Collector. The Client is your actual code, whether it is a Python script, a shell command, or a background worker. The Collector is a centralized service, such as StatusPulse, that waits for these incoming signals. This setup creates a "dead man's switch" for your infrastructure. If the Client stops sending signals, the Collector notices the silence and triggers an alert. It is a simple, elegant way to ensure that "no news" actually means "bad news."
Security is a major driver for this approach. Traditional monitoring requires you to open inbound firewall ports so external probes can enter your network. This creates unnecessary surface area for attacks. Inverse polling only requires outbound HTTPS traffic, which is already standard for most environments. It is safer and more efficient. You don't need to install heavy, resource-hungry observability agents that consume hundreds of megabytes of RAM. A simple curl command is often all you need to keep your systems visible.
Push vs. Pull: Choosing the Right Direction
Pull monitoring is excellent for synthetic testing. It tells you what your customers see when they visit your homepage. However, push monitoring is essential for the "engine room" of your application. Use push signals for firewalled scripts, IoT devices, and database backups. A hybrid approach provides 360-degree visibility. Use pull checks for your API's front door and push heartbeats for the background tasks that keep that API populated with data.
The Mechanics of an "I Am Alive" Signal
Most heartbeats use a simple HTTP GET or POST request. It is the most accessible method for modern developers. For high-frequency systems where network overhead is a concern, some teams opt for UDP signals to reduce latency. Sophisticated implementations often utilize a Phi Accrual Failure Detector to account for network jitter without causing false alarms. Inverse polling is a security-first monitoring pattern that prioritizes outbound signals over intrusive external probes.
Beyond the Ping: Schedule, Grace, and Payload Capture
Most monitoring tools treat heartbeats like a binary switch. It's either up or down. That's a lazy approach to infrastructure. Reliability requires context. To truly Monitor Heartbeat (cron / push); inverse polling; schedule + grace; payload capture; silent-failure detection, you need to define three specific variables: schedule, grace period, and timeout. This "Golden Trio" transforms a simple ping into a robust contract between your task and your monitor.
The schedule defines the expected rhythm. The grace period provides a buffer for natural execution variance. The timeout acts as a safety net for hung processes. Together, they allow you to distinguish between a slightly delayed task and a genuine failure. Beyond timing, metadata tracking adds a layer of intelligence. Capturing execution duration and memory usage helps you spot performance degradation before it causes a total crash. StatusPulse manages this metadata with precision, providing clear audit trails and data retention without the corporate bloat or complex pricing of traditional enterprise suites.
Mastering the Grace Period
Expecting a job to finish exactly at 2:00 AM is a recipe for false positives. Network latency and server load create jitter. If your monitor triggers an alert at 2:01 AM for a job that usually takes 60 seconds, you're dealing with alarm fatigue. Calculate your grace period based on historical task jitter. If a job typically takes five minutes but occasionally takes seven, set your grace period to ten. This ensures you only receive alerts when something is actually wrong. It keeps your team calm and focused.
Payload Capture for Faster Debugging
Payload capture is where technical precision meets ethical engineering. Don't just alert that a job failed; show why it failed. By sending the last 100 lines of stderr in your heartbeat request, you eliminate the need to hunt through remote logs in the middle of the night. You can also use JSON payloads for structured status updates from your application logic. Always redact sensitive information like API keys or PII before pushing data to the monitor. It's about giving your specialists the context they need to resolve incidents in minutes, not hours.
Implementation Strategies for Modern DevOps
Implementation is where theory meets reality. Many developers make the mistake of simply appending a curl command to their crontab. This is a fragile approach. If the curl fails, you lose visibility. If the script hangs, you never get the signal. A professional setup requires a structured workflow. To effectively Monitor Heartbeat (cron / push); inverse polling; schedule + grace; payload capture; silent-failure detection, you must integrate the signal directly into your execution logic.
First, define your monitor in StatusPulse. You will receive a unique UUID. This is your endpoint. Second, wrap your command in a shell script. This script should handle exit codes properly. Don't assume a completed process is a successful one. Third, use curl or a native library to ping the "start" endpoint when the job begins and the "success" endpoint when it finishes. This allows you to track duration and detect hung processes. Fourth, configure your alerting thresholds. One missed beat might be a network flicker. Two missed beats is a confirmed incident. Finally, link this data to your public status page. This ensures your stakeholders see the truth in real time.
The "Success-Only" vs. "Start-Stop" Pattern
The Success-Only pattern is best for short-lived tasks. If a job runs in under 60 seconds, a single ping at the end is sufficient. It detects when a job fails to complete. However, for long-running tasks like database migrations or massive backups, use the Start-Stop pattern. This detects jobs that start but hang indefinitely. It provides a more granular view of your system health. Choosing the right pattern depends on your tolerance for delay.
Code Snippets: Python, Node.js, and Bash
A robust Bash wrapper is your first line of defense. It should capture stderr on failure and send it as a payload. Python users can use the requests library. Always include a timeout to prevent the monitor from hanging your main process. For Node.js, integrate the heartbeat into your background worker's hooks. This ensures your microservices stay visible even when they're buried deep in your private network. This level of precision is what separates specialists from generalists.
Ready to secure your background jobs? Start monitoring your heartbeats with StatusPulse today.
StatusPulse: Turning Heartbeats into Incident Transparency
Internal monitoring shouldn't stay trapped in a DevOps silo. If your data pipeline stops, your customers will eventually feel the impact. StatusPulse bridges this gap by turning internal signals into external transparency. It allows you to Monitor Heartbeat (cron / push); inverse polling; schedule + grace; payload capture; silent-failure detection while syncing that health data directly to your public status page. This automation removes the risk of human error during an outage. It ensures your status page reflects the ground truth of your infrastructure, not just the public-facing endpoints that are easy to measure.
Our AI-powered incident management tools change how you handle failures. When a heartbeat is missed, our AI analyzes the captured payload data. It identifies the root cause and drafts a clear, concise incident summary. You don't have to start from a blank page while your system is down. You remain the final authority. You review, edit, and publish. This process respects your time and reduces the stress of manual reporting. Because we are a principled team, we host our infrastructure in the EU. This ensures your monitoring remains GDPR-compliant and adheres to the highest privacy standards.
Honest Monitoring for Better Customer Relationships
Transparency is a competitive advantage. It builds a foundation of trust that prevents churn during backend disruptions. By linking your heartbeats to your status page, you bridge the gap between technical operations and customer success. It's a grounded approach to communication that prioritizes integrity over marketing spin. For more on building reliable systems, check out Uptime Monitoring: A Developer’s Guide.
Getting Started with StatusPulse
You can deploy your first heartbeat monitor in under 60 seconds. We avoid the complex pricing models and corporate bloat that define industry incumbents. We offer a fair, ethical alternative for teams that prioritize precision over flashiness. Our tools act as assistants, providing the data you need to make informed decisions without unnecessary fluff. Start monitoring your heartbeats with StatusPulse today.
Eliminate the Risk of Silent Infrastructure Failures
Silent failures are a choice, not an inevitability. You now have the framework to move beyond the "illusion of stability" by implementing a robust dead man's switch for every background task. By focusing on the mechanics of inverse polling and the precision of grace periods, you can eliminate the stress of unmonitored cron jobs. You've seen how capturing stderr payloads saves hours of debugging. You've also seen how transparent status pages build lasting customer trust. It's time to stop guessing and start knowing.
It's essential to Monitor Heartbeat (cron / push); inverse polling; schedule + grace; payload capture; silent-failure detection with a tool built for specialists. StatusPulse provides a zero-bloat, developer-first experience that prioritizes technical integrity over flashy marketing. We offer EU-based GDPR compliant hosting and AI-assisted incident management to streamline your response times. Our pricing is fair and transparent. We are the ethical alternative to corporate incumbents. Eliminate silent failures with StatusPulse heartbeat monitoring and gain the peace of mind your team deserves. Your systems are working hard. Make sure they have a voice.
Frequently Asked Questions
What is heartbeat monitoring and how does it differ from uptime checks?
Heartbeat monitoring is an inside-out signal where your task notifies the monitor of its success. Uptime checks are outside-in, where a monitor pings a public URL to see if it responds. Heartbeats detect failures in background tasks that don't have a public endpoint. They are the primary way to Monitor Heartbeat (cron / push); inverse polling; schedule + grace; payload capture; silent-failure detection in private environments where external probes can't reach.
Can I monitor cron jobs on a server behind a firewall without opening ports?
Yes, you can monitor jobs behind a firewall without opening any inbound ports. Heartbeat monitoring relies on outbound HTTPS requests. Your server only needs to reach our collector to send its signal. This approach maintains your security posture and avoids the risks of exposing internal services to the public internet. It's a simple, secure way to keep your private infrastructure visible.
How much "grace period" should I give a job that runs every hour?
A grace period should typically be double your task's maximum expected duration jitter. If an hourly job usually takes 5 minutes but sometimes takes 10 due to high load, a 15 minute grace period is appropriate. This buffer prevents false positives from minor network delays or temporary resource contention. It ensures your team only receives alerts for genuine failures rather than routine execution variance.
What happens if my server loses internet connection and can’t send a heartbeat?
The monitor treats the lack of a signal as a failure. This is a core strength of the dead man's switch pattern. If your server cannot send a heartbeat, it likely cannot perform its task or upload its results either. You'll receive an alert because the expected signal never arrived. It provides immediate visibility into network-level isolation that traditional uptime checks might miss.
Is it possible to capture error logs and send them with the heartbeat signal?
Yes, you can include stdout or stderr output in the body of your heartbeat request. This is known as payload capture. It allows you to see exactly why a script failed without logging into the server manually. StatusPulse displays these logs directly in your incident dashboard. This context speeds up resolution times and reduces the stress of investigating silent-failure detection in the middle of the night.
Can I use heartbeat monitoring for IoT devices or mobile apps?
Heartbeat monitoring is ideal for IoT devices and mobile background workers. These systems often operate on intermittent connections or behind cellular NATs. By sending a periodic "I am alive" signal, you ensure the device is still functioning and connected to your network. It's a lightweight, efficient alternative to maintaining a persistent socket connection which can drain battery and consume excessive data.
How does StatusPulse handle false positives during scheduled maintenance?
You can pause heartbeat monitors or define maintenance windows within the StatusPulse dashboard. This prevents alerts from triggering while you perform planned updates or server reboots. Our system respects these windows to ensure your on-call team isn't bothered by expected downtime. It keeps your alert noise low and ensures that every notification you receive is actually worth your attention.
What is the difference between a "ping" and a "heartbeat" in DevOps terms?
A ping is a network-level test to see if a host is reachable. A heartbeat is an application-level signal confirming a specific process completed successfully. Pings tell you the server is powered on. Heartbeats tell you the work is actually getting done. This distinction is critical for specialists who need to ensure that database backups and data pipelines are functioning correctly behind the scenes.


