Your monitoring dashboard shows a sea of green, yet your support inbox is exploding with reports of broken checkouts. This is the "HTTP 200 Delusion." A web server that's reachable but unable to talk to its data store is functionally down, even if the load balancer thinks everything is fine. You shouldn't have to spend thousands on enterprise suites or waste weeks on configuration just to avoid these silent outages.
We agree that standard uptime checks are often a false metric for reliability. To build a truly resilient stack, you must Monitor Your Database and Not Just Your Homepage with Direct Postgres MySQL SQL Server and Redis Health Checks. This approach ensures your monitoring reflects the actual user experience rather than just network reachability.
In this article, you'll learn how to implement direct probes for modern versions like Postgres 18.4, MySQL 9.7.0, SQL Server 2025, and Redis 8.8.0. We will move past simple port pings and look at the functional checks that keep your production environment stable without the bloat of traditional observability tools.
Key Takeaways
- Identify why "Zombie Pages" occur when CDNs return successful status codes while your underlying data layer is completely unresponsive.
- Learn to configure restricted, read-only monitoring users to perform non-destructive queries like "SELECT 1" without risking production performance.
- Understand how to monitor complex states, including SQL Server Availability Groups and Redis eviction policies, rather than relying on simple port reachability.
- Implement deep probes to Monitor Your Database and Not Just Your Homepage with Direct Postgres MySQL SQL Server and Redis Health Checks and eliminate silent outages.
- Automate incident communication by linking database probes to public status pages for real-time stakeholder transparency and AI-assisted updates.
The HTTP 200 Delusion: Why Frontend Monitoring Isn't Enough
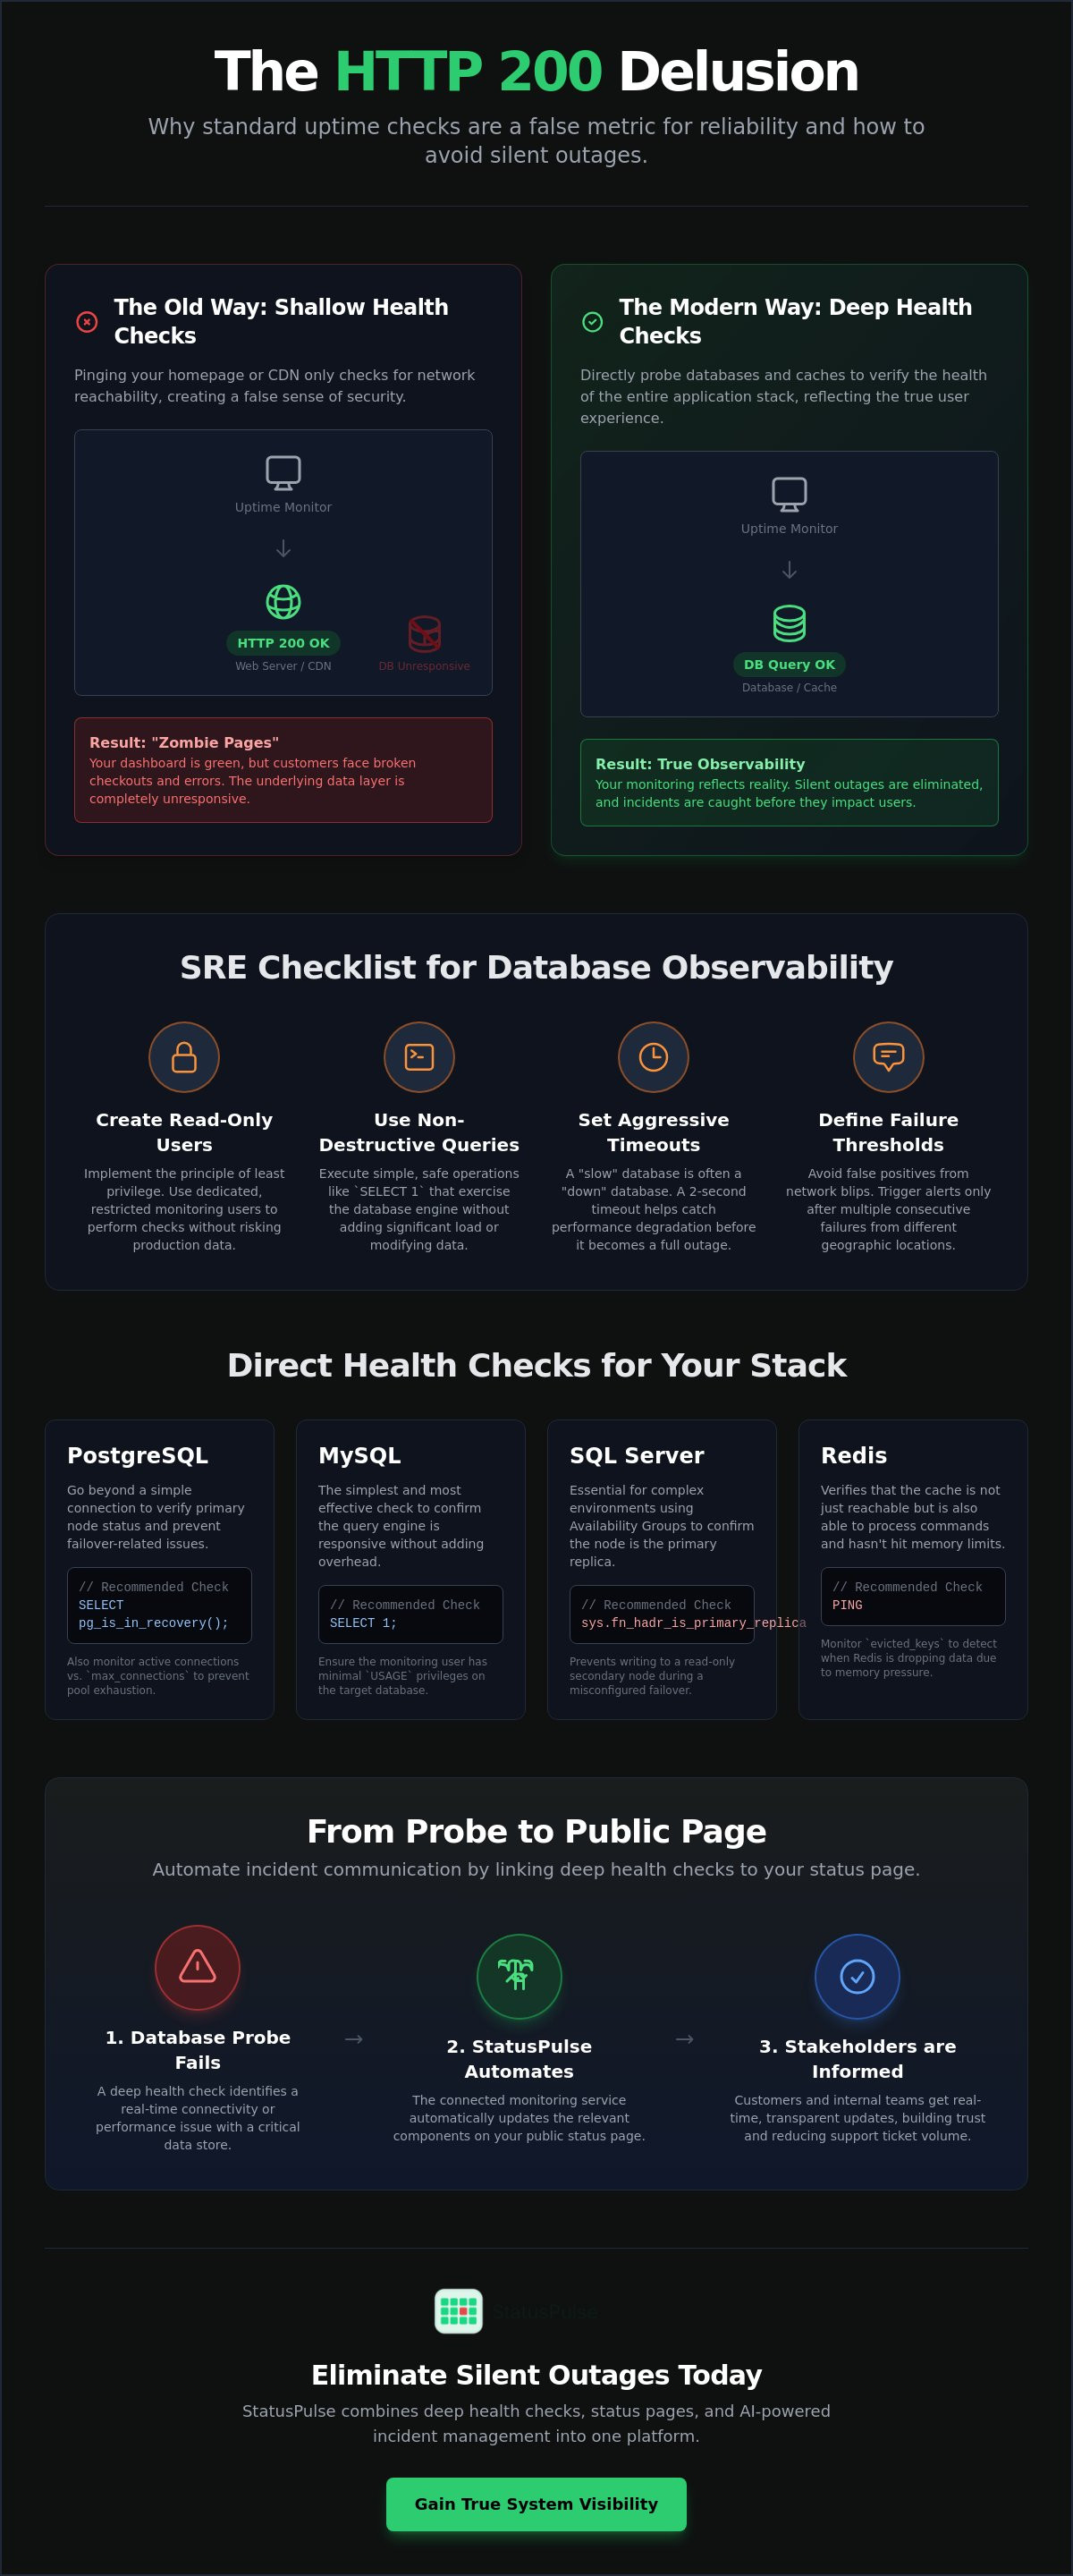
Standard uptime monitoring is a safety net with massive holes. If your monitor only pings your homepage, you're likely missing silent failures that frustrate users. We call this the "Zombie Page" phenomenon. Your CDN or edge cache serves a cached version of your site, returning a crisp HTTP 200 OK to the world, while your database server is actually in a death spiral. To avoid this, you must Monitor Your Database and Not Just Your Homepage with Direct Postgres MySQL SQL Server and Redis Health Checks.
Shallow health checks only verify that the web server process is running. They don't account for the complex interactions happening in the background. CDNs are designed to protect your origin. During a database outage, the origin might start throwing errors. However, if your "Stale-While-Revalidate" headers are set aggressively, the CDN will keep serving old content to your monitor. Your customers see a broken "Add to Cart" button, but your dashboard stays green. While Database activity monitoring (DAM) is often used for security and auditing, the same principles of transaction analysis apply to availability. A deep health check moves beyond the surface by executing a real, non-destructive query to confirm end-to-end connectivity.
The Anatomy of a Silent Database Outage
Silent outages often stem from connection pool exhaustion. Your app might still accept requests, but every attempt to fetch data hits a wall. This results in intermittent 500 errors that a once-a-minute ping might miss. Another risk is the "Read-Only" failure. This happens when a database remains reachable but stops accepting writes due to disk space issues or misconfigured failover states. A Deep Health Check is a monitoring probe that performs a non-destructive database operation to verify full-stack availability. Without this, you're essentially guessing about your system's health.
Why Application Health Endpoints Often Lie
Many teams rely on a /health endpoint within their application code. This creates a circular dependency. If the database is under heavy load, the logic required to render that health status might time out or fail entirely. Mismatched timeouts between the monitor and the application also create false positives. By using direct database probes, you bypass the application layer. This allows for cleaner root-cause analysis and ensures that uptime monitoring reflects the actual state of your infrastructure. It's the only way to Monitor Your Database and Not Just Your Homepage with Direct Postgres MySQL SQL Server and Redis Health Checks without trusting a middleman that might be compromised by the very outage you're trying to detect.
Implementing Direct Health Checks for Postgres and MySQL
Setting up an external monitor requires a strategy that balances security with visibility. You shouldn't use your application's primary credentials for these probes. Start by creating a restricted, read-only monitoring user with minimal permissions. This follows SRE best practices for data integrity and security. Once the user is ready, configure your monitoring service to connect via the standard port (5432 for Postgres or 3306 for MySQL).
Execution matters. Choose a non-destructive query that exercises the database engine without adding load. Set aggressive but realistic timeouts; a two-second limit helps you catch "slow" databases before they become "down" databases. Finally, define a failure threshold. A single network blip shouldn't trigger an alert. Three consecutive failures from different nodes usually indicate a genuine incident. This structured approach allows you to Monitor Your Database and Not Just Your Homepage with Direct Postgres MySQL SQL Server and Redis Health Checks effectively.
PostgreSQL: Beyond the Basic Connection
Postgres monitoring should verify more than just a TCP handshake. You need to know if the instance is actually writable or if it has slipped into an unintended state. Use a dedicated user with restricted access:
CREATE USER status_monitor WITH PASSWORD 'secure_password';
GRANT CONNECT ON DATABASE production_db TO status_monitor;
We recommend monitoring the pg_is_in_recovery() function. If this returns true on what should be your primary node, a failover has occurred. Additionally, check active connection counts against max_connections. Catching pool exhaustion early prevents the intermittent 500 errors discussed in the previous section.
MySQL: Verifying Availability and Latency
In MySQL environments, SELECT 1 serves as a reliable, lightweight heartbeat. However, reachability isn't the only metric. Monitor the Threads_connected global status variable to detect sudden spikes in traffic or stuck queries. If your connection count nears the limit, your application will start rejecting new requests even if the server process is "up."
Data sovereignty is a frequent concern for European teams. You can use StatusPulse to run these uptime monitoring checks from specific EU or US regions. This ensures your probes comply with local privacy standards while verifying that your database is reachable from the same geographic locations as your users. It's a straightforward way to Monitor Your Database and Not Just Your Homepage with Direct Postgres MySQL SQL Server and Redis Health Checks without the complexity of traditional enterprise suites.
Monitoring SQL Server and Redis: Handling State and Cache
SQL Server and Redis present unique monitoring hurdles compared to standard relational databases. While Postgres and MySQL are often about connection counts, SQL Server and Redis require a deeper understanding of internal states. For example, a SQL Server instance might be "up," but if an AlwaysOn Availability Group has failed over or is in a resolving state, your application logic will still break. You must Monitor Your Database and Not Just Your Homepage with Direct Postgres MySQL SQL Server and Redis Health Checks to catch these state-driven failures. Security is also paramount. Always use SSL/TLS for these monitoring connections over public networks to protect your credentials and metadata.
SQL Server Health Check Strategies
SQL Server monitoring often gets bogged down in enterprise bloat. Instead of installing heavy agents, you can verify liveness by querying sys.databases. This confirms the engine is not just running but that specific databases are online and accessible. In multi-instance environments, ensure you use static ports, typically 1433, rather than dynamic ones to avoid connection flakiness. StatusPulse supports these direct SQL Server probes natively. This removes the need for complex on-premise monitoring software that takes weeks to configure.
Redis: Monitoring the Heartbeat of Your Cache
Redis "uptime" is a deceptive metric. A Redis instance can be reachable but functionally useless if it has reached its memory limit and the eviction policy is failing. This aligns with core SRE observability principles, where you look at the internal health of a service rather than just its external port. A simple PING command is a start, but it doesn't guarantee the cache is actually working.
# Basic Redis Heartbeat
$ redis-cli PING
PONG
A better test is a SET/GET operation on a dedicated monitoring key. This verifies the socket is responsive and the memory is writable. You should also monitor used_memory_rss. If memory usage is high, Redis may stop responding to new requests or start evicting critical session data. This "Silent Redis Death" happens when the process stays alive but the socket becomes unresponsive due to memory pressure. To maintain a reliable stack, you need to Monitor Your Database and Not Just Your Homepage with Direct Postgres MySQL SQL Server and Redis Health Checks to ensure your caching layer isn't the weak link in your infrastructure.
The SRE Checklist for Database Observability
Observability fails when it becomes a wall of noise. To build a reliable system, you must Monitor Your Database and Not Just Your Homepage with Direct Postgres MySQL SQL Server and Redis Health Checks. This checklist moves beyond basic hardware stats like RAM or Disk I/O. It focuses on the signals that actually impact your users. A structured approach ensures you only alert when a genuine incident occurs.
- Connectivity: Confirm the monitor can reach the database port from multiple nodes, such as EU and US locations.
- Authentication: Verify that monitoring credentials remain valid and follow your internal rotation policies.
- Latency: Track query response times. Anything over a 500ms threshold usually indicates a performance bottleneck.
- State: Ensure the database is in the correct mode. A primary node stuck in read-only mode is functionally down for writes.
- Transparency: Link these checks to your public status page. This automates stakeholder communication the moment a probe fails.
Setting Realistic Alert Thresholds
A single failed check is rarely a crisis. It's often a transient network hiccup. Triggering an alert for every blip causes alert fatigue. We recommend a "3 failed checks in 3 minutes" rule. This filters out noise while ensuring you catch sustained outages. For critical production environments, use 1-minute check intervals. This provides enough granularity to detect issues without overwhelming your logs. Use hysteresis to solve the "flapping" problem, where a service rapidly toggles between up and down states. This ensures an incident is only marked as "resolved" after multiple successful consecutive checks.
Data Sovereignty and Regional Monitoring
Monitoring from the same region as your application is vital for accurate latency data. If your app is in Frankfurt, a monitor in Oregon won't give you a true picture of performance. Privacy regulations also play a role. StatusPulse allows you to choose between EU or US hosting to maintain strict GDPR compliance. Multi-region monitoring prevents false positives caused by isolated regional ISP failures. By verifying health from both EU and US nodes, you confirm that your data layer is globally accessible. This is the most reliable way to Monitor Your Database and Not Just Your Homepage with Direct Postgres MySQL SQL Server and Redis Health Checks while respecting data sovereignty.
You can start using these professional uptime monitoring probes today to eliminate silent database failures and improve your incident response times.
Integrating Database Health into StatusPulse Status Pages
A monitoring alert is only the first step. If your database is down, your stakeholders need to know the impact and the estimated resolution time. Most legacy tools isolate monitoring from communication. This creates a manual bottleneck during a crisis. By using a native integration, you can Monitor Your Database and Not Just Your Homepage with Direct Postgres MySQL SQL Server and Redis Health Checks and have those results flow directly into your status page. This removes the friction of manual updates during an incident.
StatusPulse uses AI to translate technical failures into human-readable summaries. If a Postgres probe fails due to connection pool exhaustion, the AI identifies the impact for non-technical users. It might suggest a summary like "Users may experience delays during checkout" rather than "Error: 53300 too many connections." This promotes an honest communication strategy. You can define when a failure constitutes a "Partial Outage" versus a "Major Outage." This level of transparency builds trust with your users. Unlike enterprise suites that charge per subscriber, our flat pricing model lets you monitor as many databases as you need without financial penalties.
Automating the Incident Lifecycle
Automation shouldn't mean losing control. When a SQL probe fails, StatusPulse immediately creates an automated incident draft. This draft includes the exact timestamp and the specific error code detected by the monitor. We use a human-in-the-loop approach. The AI drafts the update, but a human hits publish. This ensures your team maintains the final say on external messaging. For a deeper look at this philosophy, see our guide on Uptime Monitoring: A Developer’s Guide to Reliability and Honest Communication.
Public vs. Private Database Status
Not every technical detail belongs on a public page. Internal names like "Postgres-Cluster-01" can be confusing or even a security risk. Use friendly, service-based names like "User Data Store" or "Search Index" for your public stakeholders. You can maintain private status pages for your internal teams that include raw logs and specific instance names. This keeps your external communication clean while giving your engineers the data they need to troubleshoot. It's a professional way to Monitor Your Database and Not Just Your Homepage with Direct Postgres MySQL SQL Server and Redis Health Checks without exposing your infrastructure's inner workings. Ready to move beyond homepage pings? Start monitoring your databases with StatusPulse today.
Secure Your Data Layer and Reclaim Engineering Time
Frontend pings aren't enough to guarantee a working application. You've learned how to identify "Zombie Pages" and why direct probes are the only way to verify true system health. By implementing these checks, you move from reactive guessing to proactive observability. It's vital to Monitor Your Database and Not Just Your Homepage with Direct Postgres MySQL SQL Server and Redis Health Checks to ensure your users never encounter a silent failure.
StatusPulse offers a straightforward path to this level of reliability. We provide EU and US data residency options for GDPR compliance and AI-powered incident management to draft updates in seconds. Our transparent pricing model has no hidden per-subscriber fees; it's built for specialists who value integrity over corporate bloat. This approach allows you to focus on building features rather than managing tool complexity.
Stop guessing and start monitoring your databases with StatusPulse. Your infrastructure deserves precision, and your team deserves fewer false alarms. Build a more resilient stack today.
Frequently Asked Questions
Is it safe to allow a monitoring service to connect directly to my database?
It is safe if you follow the principle of least privilege. Create a dedicated, read-only monitoring user with access restricted to a single non-sensitive table or a simple system command. Always enforce SSL/TLS for these connections to ensure your credentials aren't sent in plain text over the network. This setup provides the visibility you need without compromising your data security.
How much performance overhead does a database health check query create?
The performance impact is negligible for standard heartbeat queries. Executing a "SELECT 1" in Postgres or MySQL takes only a few milliseconds and uses fewer resources than a single typical application request. For Redis, a PING command is even lighter. These checks are designed to be non-destructive and low-impact, even when running at one-minute intervals on high-traffic production clusters.
Can I monitor a database that is sitting behind a firewall or in a private VPC?
You can monitor private instances by whitelisting the specific static IP addresses of your monitoring provider. This allows the probe to pass through your firewall while keeping the rest of the web blocked. It's a reliable way to Monitor Your Database and Not Just Your Homepage with Direct Postgres MySQL SQL Server and Redis Health Checks without migrating your data to a public subnet.
What is the difference between a TCP port check and a direct SQL health check?
A TCP check only confirms that the database port is open and listening. It can't tell if the database engine is actually functional. A direct SQL health check executes a real query, which confirms that the database can accept connections, parse syntax, and return data. This prevents "Zombie Page" scenarios where the port is open but the database is stuck in a deadlock.
How often should I run database health checks for a production environment?
One-minute intervals are the industry standard for production environments. This frequency allows you to detect and respond to outages quickly without flooding your logs or adding measurable load to the server. For non-critical staging or development environments, you might scale back to five-minute intervals to reduce noise and focus on higher-level availability trends.
Does StatusPulse support custom SQL queries for health checks?
Yes, you can define specific SQL strings or commands for your probes within the dashboard. This allows you to check for more than just liveness. You can monitor specific table availability or check system functions like replication lag and recovery states. This flexibility ensures your Monitor Your Database and Not Just Your Homepage with Direct Postgres MySQL SQL Server and Redis Health Checks strategy fits your unique architecture.
Should I monitor my database from multiple geographic regions?
Monitoring from multiple regions is the best way to avoid false positives caused by regional ISP outages. If your database is reachable from your EU nodes but not from your US nodes, you know the issue is likely network-related rather than a total database failure. This global perspective is essential for maintaining an accurate and trustworthy public status page for a global user base.
How do I prevent my status page from flickering during transient database blips?
Use failure thresholds to filter out transient network noise. Instead of triggering an incident on the first failed check, configure your monitor to wait for three consecutive failures. This ensures that a temporary routing hiccup doesn't send out unnecessary notifications. Combined with hysteresis, this approach ensures your status page only reflects sustained, genuine service disruptions.