

A 200 OK response code does not mean your application is working. Too often, passive server monitoring reports green while users face broken authentication flows or empty screens. Silent micro-outages slip past edge proxies, and transient network blips flood on-call rotations with noisy pages. Synthetic uptime checks solve this blind spot by simulating real client requests from outside your perimeter, testing critical application state before an incident hits your support queue.
You already know the frustration of alert fatigue and enterprise observability platforms that charge punitive seat fees for basic coverage. In this guide, you'll learn how synthetic uptime checks detect outages before your users do, how to configure multi-step API journeys, and where they fit inside a modern reliability stack. We'll examine probe architecture from simple TCP pings to authenticated transactions, refine thresholds to eliminate false positives, and build a lean monitoring setup that keeps operational costs predictable.
Key Takeaways
- Learn how synthetic uptime checks validate real application state beyond basic HTTP 200 codes to catch failures before users experience them.
- Discover how to balance lightweight Layer 4 connectivity checks with multi-step API assertions without overspending on compute.
- Master multi-location verification and retry thresholds that filter out transient network blips and eliminate alert fatigue.
- Evaluate the architectural trade-offs between self-hosted probes and managed platforms while maintaining data sovereignty in the EU or US.
- Automate the workflow between failed probe assertions and public status page updates to maintain clear, reliable incident communication.
What Are Synthetic Uptime Checks and How Do They Work?
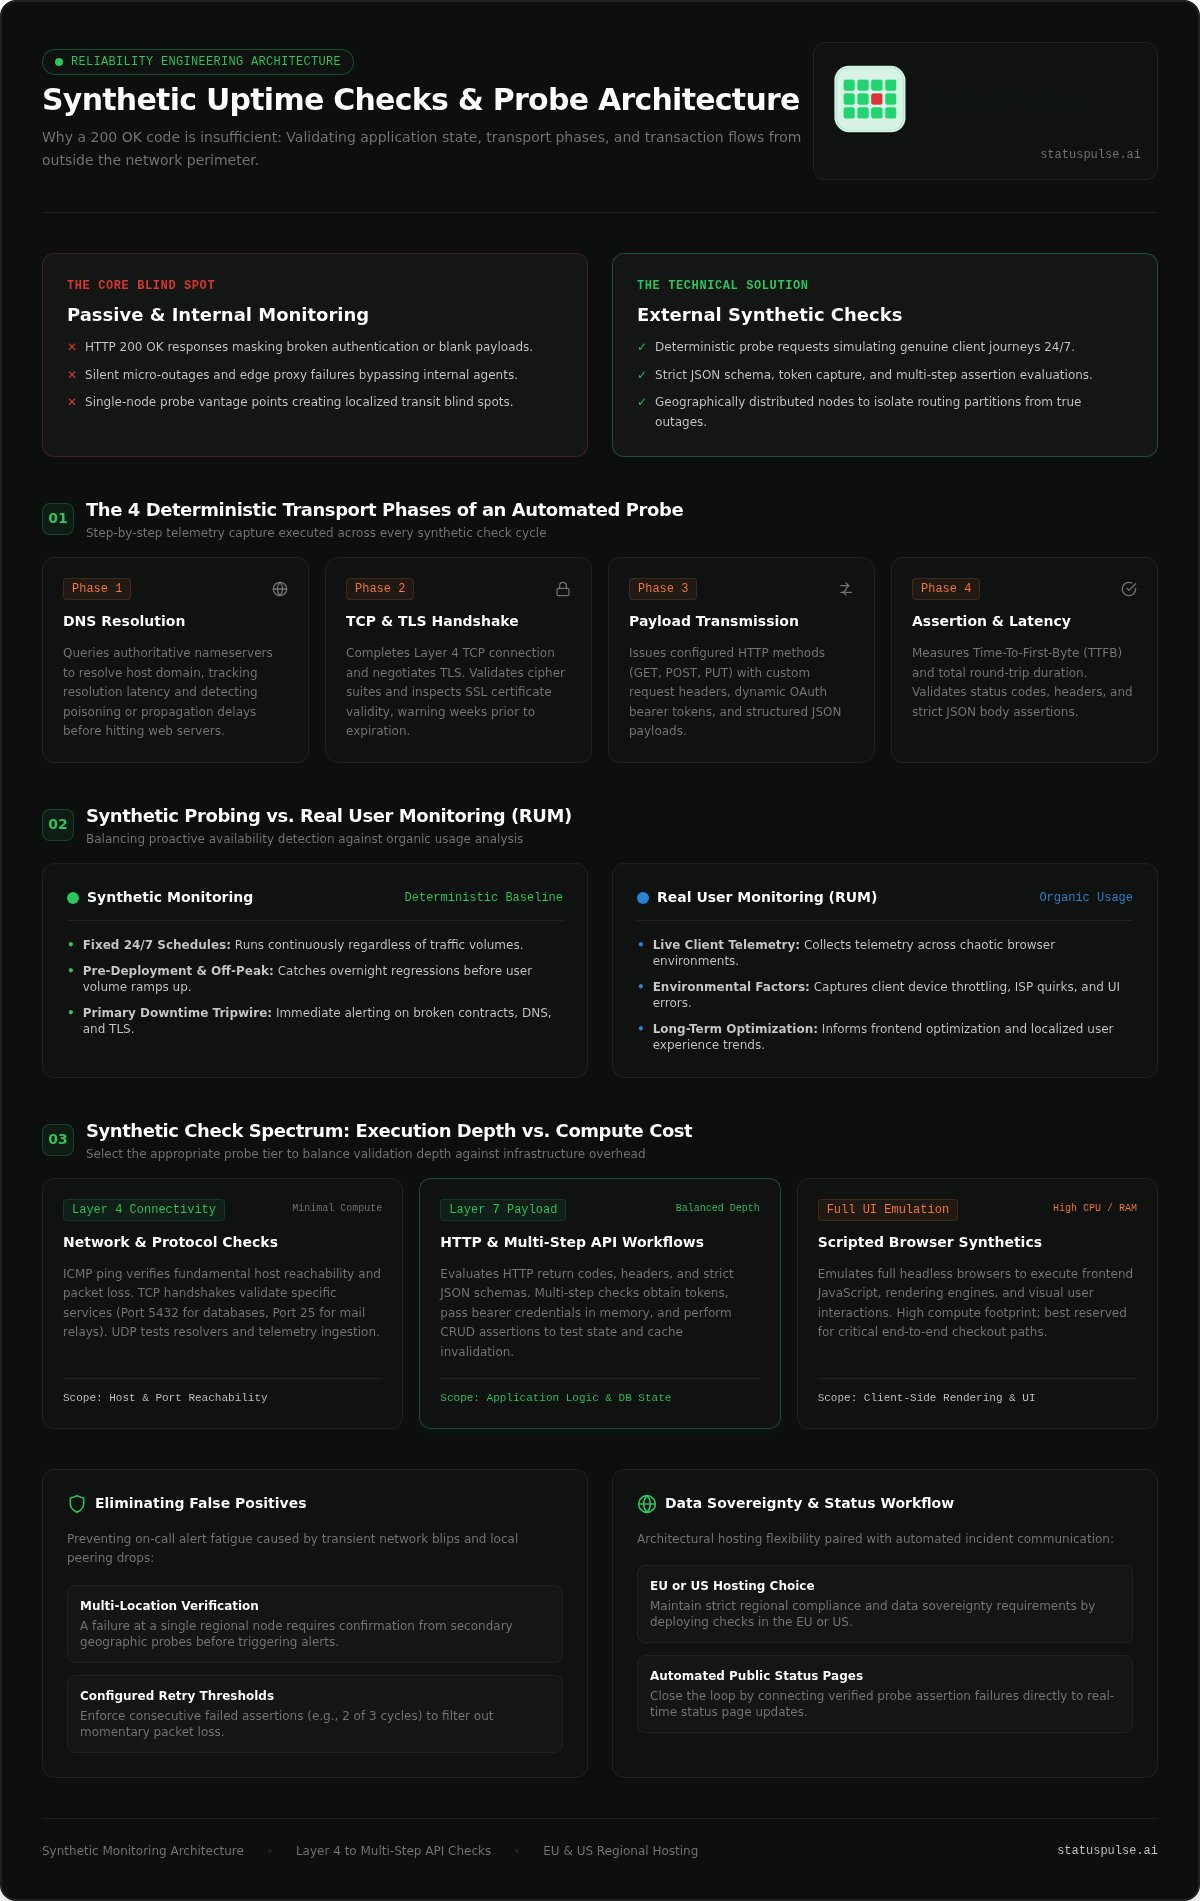
A synthetic uptime check is an automated probe that dispatches programmed requests to an endpoint at predefined intervals, validating DNS health, network transport, response codes, and payload assertions. Rather than waiting for an engineer to report a broken endpoint or a customer to tweet about a login failure, synthetic probes run proactively. They test paths from outside your private network perimeter to expose production incidents immediately.
Executing checks from a single server creates blind spots. A localized transit issue or ISP peering failure can make your application appear completely dark to a subset of users, while your primary data center reports zero errors. Distributed synthetic monitoring deploys probes across distinct geographical nodes. This model isolates localized routing partitions from true system outages, giving operations teams actionable geographic context during an active triage cycle.
The Mechanics of an Automated Probe
When an automated monitoring agent tests a service, it runs through four deterministic transport phases:
- DNS resolution: The probe queries authorative nameservers to resolve your domain. It measures resolution latency and detects DNS poisoning or propagation failures before any packet hits your web server.
- TCP handshake and TLS negotiation: The node completes a Layer 4 TCP connection, then initiates the TLS handshake. It inspects certificate validity, verifying cipher negotiation and alerting teams weeks before expiration.
- HTTP payload transmission: The client issues the configured request method (GET, POST, PUT) alongside custom headers, authentication tokens, or request bodies.
- Assertion evaluation and latency aggregation: The engine measures time-to-first-byte (TTFB) and total round-trip duration. It validates response headers, status codes, and JSON response bodies against strict programmatic assertions.
Synthetic Probing vs Real User Monitoring (RUM)
Reliability teams often debate whether to rely on synthetic tests or client-side telemetry. As outlined in the fundamental definitions of synthetic monitoring, the distinction lies between deterministic baselines and organic usage.
Synthetic checks run on fixed schedules 24 hours a day. They maintain an uninterrupted performance baseline during low-traffic windows, like overnight deployments, catching regressions before traffic volumes ramp up. In contrast, Real User Monitoring tracks live browser interactions across chaotic client environments, capturing device throttling, local ISP quirks, and real-world UI regressions. Reliable engineering organizations pair the two disciplines; synthetic checks serve as the primary automated tripwire for immediate downtime, while RUM guides long-term frontend optimization.
Synthetic Check Types: From Simple Pings to API Workflows
Different synthetic uptime checks strike distinct balances between execution depth and compute overhead. A lightweight network probe costs fractions of a cent, while a scripted browser journey burns significant CPU and memory. Effective reliability engineering avoids using heavy browser emulators where lightweight assertions do the job.
Network and Protocol-Level Health Checks
Low-level network probes verify core infrastructure before touching the application layer. ICMP ping checks evaluate fundamental host reachability and packet loss across public networks. They tell you if a server is online. They won't tell you if web services are accepting connections.
TCP port checks solve this by establishing Layer 4 handshakes against specific daemons. Probing port 5432 confirms your database accepts traffic; testing port 25 validates your mail relay. UDP checks cover stateless protocols, confirming connectivity for DNS resolvers, media streams, and custom telemetry ingest points.
HTTP and Advanced API Payload Validations
Single-endpoint HTTP checks verify return codes, response headers, and TLS certificates. But an endpoint returning a 200 status code can still deliver an empty response or an error string inside a valid envelope. Modern synthetic uptime checks execute strict JSON payload assertions, evaluating response keys, schema structures, and data types.
Multi-step API checks extend this logic across complete workflows. A probe requests an OAuth bearer token, captures it in memory, and passes it to subsequent CRUD endpoints to test database writes and cache invalidation. Adopting sound API monitoring best practices ensures your verification catches broken dependencies without adding unnecessary latency.
Browser Synthetics vs Lightweight Headless Probes
Teams frequently default to bloated, full-browser automation when lightweight probes deliver better reliability at lower cost. Headless HTTP requests execute in milliseconds. They run at high frequencies, consume negligible compute, and provide clear root-cause isolation when an endpoint fails.
Full browser tests spin up headless instances of Chromium to render the DOM and execute client-side JavaScript. They are essential for validating complex frontends, like an e-commerce checkout or an interactive onboarding step. However, browser tests are brittle, slow, and expensive. As IBM notes in their overview of building a proactive monitoring solution, engineering teams achieve the highest efficiency by using headless API probes for continuous uptime checks, reserving full browser runs for business-critical user journeys.
Configuring Resilient Synthetic Checks Without Alert Fatigue
Misconfigured tests destroy engineering trust faster than actual downtime. When transient packet jitter or a minor edge routing flutter triggers a midnight page, on-call teams burn out quickly. If engineers mute notifications to stay sane, true outages slip past unnoticed. Configuring resilient synthetic uptime checks requires calibrating failure thresholds, setting practical network budgets, and eliminating single-node alerting assumptions.
Regional failure consensus dictates that an alert triggers only when two or more distinct geographic probe locations register consecutive assertion failures within the same verification window.
Multi-Region Probing and Consensus Rules
Never dispatch an outage notification based on a single node's report. Localized network routing anomalies, BGP path flaps, and cloud provider hiccups occur constantly. Requiring dual-location confirmation prevents transient network noise from waking your team.
Distribute monitoring probes across both EU and US networks to maintain broad coverage and independent verification paths. Examining Wikimedia's documented real-world synthetic testing architecture demonstrates how distributed probe nodes isolate localized network partitions from core infrastructure failures, ensuring teams only respond to genuine system-wide downtime.
Timeout Calibration and SSL Inspection
Aggressive timeouts create noisy alerts. While an internal API might usually respond in 150 milliseconds, setting a one-second timeout threshold guarantees false positives during minor network spikes. Calibrate HTTP connection timeouts between 5 and 10 seconds for standard web applications, giving edge proxies enough headroom to handle transient load.
Pair transport health directly with endpoint availability. Unplanned certificate expirations still cause preventable downtime across modern systems. Leveraging automated SSL monitoring mechanics alongside your availability checks flags expiring certificates 30 days ahead of time, ensuring automated renewal pipelines work without breaking client trust.
Managing Probe Hygiene and Production Rate Limits
Synthetic probes can easily trigger your own defensive infrastructure if left unconfigured:
- Allowlist probe IPs: Add known probe addresses to cloud security groups and web application firewalls (WAF) to prevent false alerts caused by rate-limiting rules.
- Set custom headers: Define explicit User-Agent strings like
StatusPulse-Probe/1.0to filter synthetic requests out of product analytics and business reporting. - Restrict test credentials: Run multi-step API tests using dedicated test accounts scoped with read-only permissions, safeguarding production databases from data pollution.
Synthetic Monitoring Architecture: Self-Hosted vs SaaS Platforms
Engineering teams face a fundamental architectural choice when designing synthetic uptime checks: maintain internal probe scripts or use a managed platform. Self-hosted tools grant deep visibility into private VPCs and on-premise environments. Managed external platforms deliver true client-side perspectives independent of your underlying cloud infrastructure.
The Limitations of Self-Hosted Health Check Scripts
Spinning up a Prometheus Blackbox exporter instance inside your own AWS or Google Cloud environment is straightforward. The architectural flaw lies in shared failure domains. If an availability zone network partition disrupts your primary cluster, it often takes down your self-hosted probe runners alongside it.
Maintaining a multi-cloud probe fleet across three or four external regions introduces considerable operational drag. You must manage security updates, TLS cert stores, and reliable queuing just to keep checks running. When an internal Redis broker saturates during an incident, your self-hosted alerting pipeline can fail silently.
The Problem with Enterprise SaaS Observability Bloat
Turning to legacy enterprise observability suites solves hosting maintenance, but it creates financial and operational headaches. Incumbents structure pricing around complex metrics ingestion, separate multi-step run fees, and punitive per-user seat licenses. Setting up high-frequency API checks quickly leads to billing surprises at the end of the billing cycle.
These massive platforms also demand dedicated platform engineers to manage configurations and update rules. Smaller, focused monitoring platforms strip out that corporate overhead. By providing transparent flat pricing without per-seat penalties, modern platforms let engineering teams monitor their entire stack without artificial cost constraints.
Data Sovereignty and Regional Hosting Decisions
Where your synthetic monitoring telemetry resides is just as critical as how probes execute. Strict regulatory guidelines under European privacy frameworks require organizations to keep performance logs and metadata within European borders. Conversely, North American firms often mandate that monitoring data remain hosted on US infrastructure.
Avoid platforms that force all telemetry through a single jurisdiction or charge premiums for regional routing. Architectural parity between EU and US hosting options guarantees compliance with local data residency laws while running synthetic uptime checks across your target user locations.
Closing the Loop: Connecting Synthetic Checks to Public Status Pages
Catching a failing endpoint within thirty seconds means very little if your users spend the next hour wondering why their dashboard broke. Nothing erodes customer trust faster than a status page showing all green systems during an active, obvious outage. Detecting downtime is only half the battle. Clear incident communication matters just as much. Connecting automated synthetic uptime checks directly to your public status page closes the loop between fault detection and customer trust.
Automating Status Updates from Synthetic Triggers
You can map individual synthetic test assertions directly to specific status page components. When distributed probes confirm a failure on your billing API, the system automatically marks that specific component as Degraded Performance. It alerts stakeholders without requiring an on-call engineer to stop active debugging just to update a public dashboard.
Automation works just as effectively during recovery. Once regional probes complete two consecutive healthy check cycles, the platform updates the component back to Operational. This automated loop provides immediate visibility and stops support ticket spikes before they flood your help desk.
Drafting Clear Incident Communication Without Panic
Drafting public updates during an unexpected outage is stressful. Engineers trying to restore a database cluster shouldn't be forced to write customer-facing announcements on the fly. Under pressure, technical teams often write cryptic notes or stay silent for too long.
AI-assisted incident tooling can analyze raw probe failures, HTTP response codes, and latency metrics to draft concise, professional status updates in seconds. Crucially, human agency remains central to the process. The AI drafts the summary, but an engineer reviews, adjusts, and approves the text before publishing anything to users.
Implementing a Streamlined Monitoring Stack
Many teams stitch together disparate monitoring scripts, third-party status vendors, and separate alerting tools. This fragmentation inflates infrastructure bills and introduces fragile webhook chains that break during real emergencies. Legacy enterprise vendors also add per-subscriber notification fees, penalizing you financially as your user base expands.
Consolidating these tools eliminates unnecessary software bloat. Exploring how StatusPulse provides unified uptime monitoring and status pages shows the value of an integrated, developer-first platform. With flat pricing, an explicit choice between EU and US data hosting, and reliable synthetic uptime checks, you can maintain authentic incident communication transparency without runaway operational overhead.
Architecting a Resilient Availability Strategy
True operational reliability requires looking past shallow HTTP status codes. Dependable synthetic uptime checks validate real application state, test critical multi-step API journeys, and enforce regional consensus to eliminate midnight false alarms. When your monitoring catches regressions before users run into them, your team spends less time fighting fires and more time shipping code.
You don't need an expensive enterprise observability suite with opaque usage tiers to protect your uptime. StatusPulse brings proactive uptime probes, automated SSL certificate tracking, and public status pages together under a single developer-first platform. With flat pricing, zero per-subscriber penalties, and your choice between EU and US data hosting for total sovereignty, monitoring stays reliable and predictable. Take control of your service availability and set up reliable synthetic uptime checks with StatusPulse today.
Frequently Asked Questions
What is the main difference between synthetic uptime checks and passive server monitoring?
Synthetic checks actively simulate user requests from external networks to evaluate response health, whereas passive server monitoring observes internal telemetry like CPU load, memory limits, and local system logs. Passive monitoring verifies your infrastructure is running. External synthetic uptime checks prove that real clients can actually complete network requests and access application services.
How frequently should I run synthetic checks on production web applications?
Most production teams execute lightweight HTTP and TCP endpoint checks every 30 to 60 seconds. Multi-step transactional workflows, like user checkouts, typically run at three- to five-minute intervals to balance observability depth with compute overhead. Setting intervals shorter than 30 seconds rarely improves recovery times and often increases the risk of false-positive rate-limit alerts.
Can synthetic uptime checks test workflows behind user authentication gates?
Yes. Synthetic engines can store environment variables, execute initial authentication handshakes against OAuth or token endpoints, and pass resulting bearer headers to subsequent requests. Scoping these test credentials to dedicated sandbox accounts with read-only database privileges protects production records while verifying that authentication gateways and secure APIs respond correctly.
How do synthetic probes avoid getting blocked by web application firewalls and bot filters?
Probes bypass aggressive bot defenses through static IP allowlisting and structured request headers. Operations teams add the monitoring provider's published egress IP ranges directly to cloud security groups and WAF policies. Setting distinct User-Agent headers also allows internal traffic management tools to identify synthetic probes cleanly without skewing web analytics data.
Why should synthetic monitoring probes be hosted outside my primary cloud provider?
Hosting probes inside your primary cloud environment creates a shared failure domain. If an availability zone network partition disrupts your main infrastructure, your internal monitoring runners often fail at the exact same moment. External multi-region probes operate on independent infrastructure, ensuring your alerting pipelines stay operational even during severe hosting provider outages.
What happens when a synthetic check detects an outage in only one geographic region?
A regional failure consensus engine marks the check as degraded rather than triggering a global outage page. The system dispatches an isolated regional alert to notify engineers of localized routing or peering problems. Outage workflows trigger only after two or more independent probe locations confirm identical assertion failures across consecutive runs.
Can synthetic uptime checks monitor SSL certificates and API schemas simultaneously?
Modern synthetic monitoring platforms inspect the complete network transport lifecycle during a single execution. During the TLS handshake, the engine records cipher validity and days remaining before certificate expiration. Immediately after connection establishment, it transmits the HTTP payload to validate that returning JSON schemas, status codes, and response headers match your defined technical assertions.


