
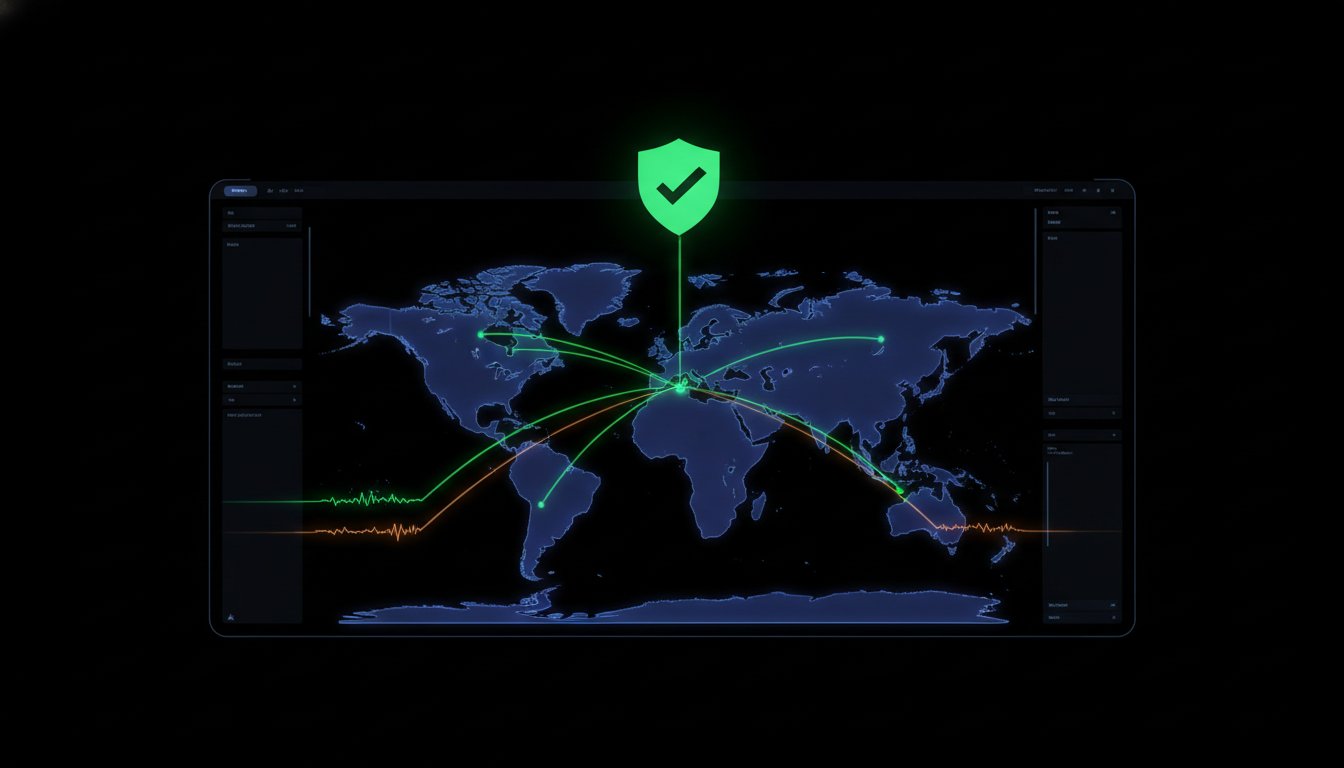
It is 3:00 AM. Your pager is screaming. You scramble to your desk only to find your site is perfectly healthy. It was a false positive; a localized routing blip in a single Singapore data center that did not affect your actual users. Chasing these ghosts is a waste of engineering time. It erodes your team's trust in your monitoring stack and leads to dangerous alert fatigue.
Reliability isn't just about having more probes. It is about the logic that filters regional noise into actionable truth. You need to monitor multi-region probes, EU/US/APAC/SA PoPs; per-region timeline; quorum rules to suppress single-region blips to ensure a single ISP hiccup doesn't trigger a full-scale incident response. This guide explores the technical architecture required to eliminate false positives while maintaining 100% visibility into global performance. We will cover how to set up quorum thresholds, visualize regional latency, and build reporting that your global customers can actually trust.
Key Takeaways
- Identify global blind spots by moving beyond single-region monitoring that often hides critical outages in APAC or South American markets.
- Implement a 4-pillar PoP strategy across the EU, US, APAC, and SA to ensure comprehensive coverage and respect regional data sovereignty.
- Master the technical architecture required to monitor multi-region probes — EU/US/APAC/SA PoPs; per-region timeline; quorum rules to suppress single-region blips.
- Utilize historical per-region timelines to distinguish between transient network noise and genuine regional performance degradation.
- Build operational trust by delivering transparent, consensus-based incident reporting that reflects the actual experience of your global users.
The Liability of Single-Region Monitoring in a Global Market
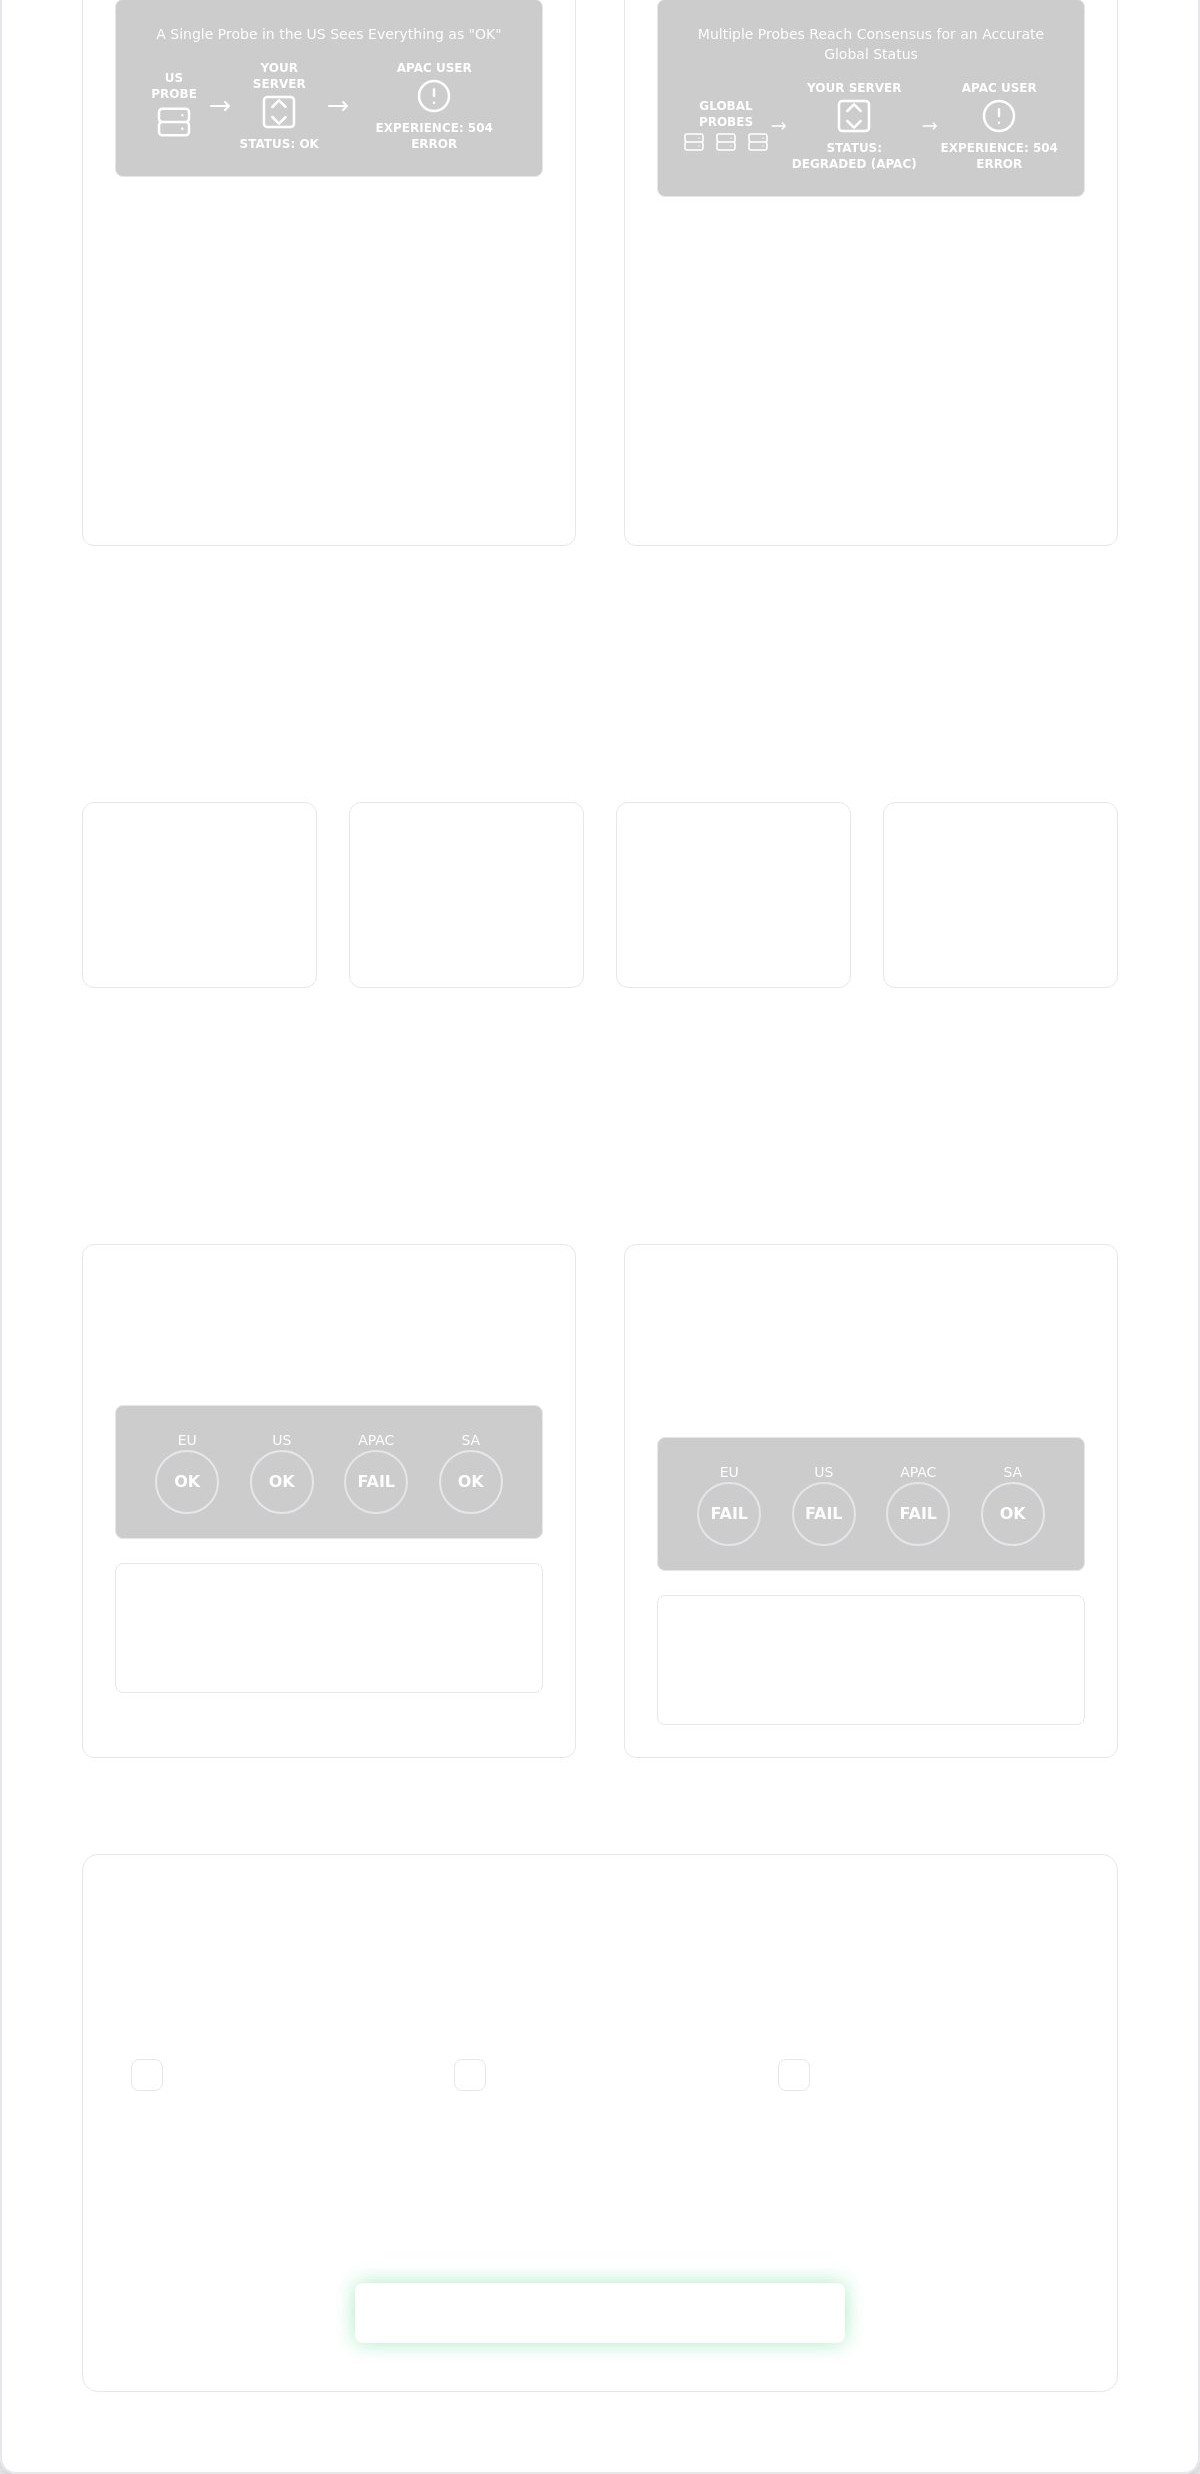
Relying on a single monitoring node is a gamble with your brand's reputation. Your dashboard might show a "Green" status because the probe is located in the same AWS region as your primary server. Meanwhile, users in Tokyo or São Paulo could be staring at 504 Gateway Timeouts or broken assets. This creates a dangerous gap between your internal metrics and the actual user experience.
To bridge this gap, you need to monitor multi-region probes — EU/US/APAC/SA PoPs; per-region timeline; quorum rules to suppress single-region blips. This approach moves beyond basic uptime and into the realm of global observability. It acknowledges that the internet is not a single, unified entity but a complex web of interconnected networks. A localized routing failure at a Tier 2 ISP shouldn't be treated the same as a total database collapse.
High latency is a silent churn driver. Research suggests that even a small increase in TTFB (Time to First Byte) can lead to a measurable drop in user retention. If your monitoring is centralized in London, you won't see the 3,000ms latency spikes affecting your APAC customers. You're essentially flying blind in your most critical growth markets.
The "Silent Outage" Problem
A "silent outage" occurs when your service is technically online but unreachable for a specific geographic cluster. This often happens due to CDN misconfigurations or WAF rules that inadvertently block IP ranges in certain countries. Without regional probes, these issues can persist for days because your primary monitoring node sees no errors.
Physical infrastructure also plays a role. Submarine cable repairs or BGP routing leaks can isolate entire regions from your origin server. By using a quorum-based technique, you can verify if a failure is systemic. If probes in the US and EU see your site but APAC is dark, you know exactly where to start your investigation.
False Positives and Alert Fatigue
Single-region setups are notorious for "flapping." This is when a temporary network hiccup between the probe and your server triggers an alert that resolves itself before you even log in. These 3 AM wake-up calls carry a high psychological cost. They lead to alert fatigue, where engineers begin to ignore notifications because they assume it's just another "blip."
This desensitization is dangerous. When a genuine, business-critical outage occurs, your team might not react with the necessary urgency. Transitioning to consensus-based monitoring ensures that alerts are only sent when multiple PoPs agree there is a problem. For a deeper look at building a reliable strategy, see this Uptime Monitoring: A Developer’s Guide.
Global Infrastructure: The 4-Pillar PoP Strategy
Strategic distribution is not about having the most probes. It is about having probes in the right places. To achieve true global observability, you must monitor multi-region probes, EU/US/APAC/SA PoPs; per-region timeline; quorum rules to suppress single-region blips. This 4-pillar approach ensures that you capture the unique network characteristics of every major market. Without this spread, your uptime data is merely a localized snapshot rather than a global truth.
European PoPs are non-negotiable for businesses serving the EU. Beyond lowering latency, they allow you to verify that your service remains accessible within the strictures of regional data sovereignty. Similarly, US PoPs monitor the backbone of global SaaS traffic. Since most major cloud providers cluster their primary infrastructure in Northern Virginia or Oregon, monitoring from these hubs helps you distinguish between a provider-wide outage and a problem with your specific application.
Adhering to recognized network monitoring standards requires moving beyond these two common regions. Reliable monitoring must account for the varied peering agreements and physical distances that define the modern internet. This is where the often-neglected markets of South America and APAC become critical components of your reliability stack.
The Importance of South American (SA) Probes
South America is frequently overlooked in standard monitoring packages. Many teams assume that a US-East probe is "close enough" to cover the Southern Hemisphere. This is a technical oversight. Routing from São Paulo to Northern Virginia often involves multiple transcontinental hops, adding significant latency and potential points of failure.
The "Speed of Light" floor for a user in Buenos Aires is vastly different from a user in New York. If you don't have a local SA PoP, you cannot accurately measure the baseline performance for these users. You miss the localized ISP outages and BGP leaks that only affect the LATAM region. Using uptime monitoring with native SA nodes ensures you aren't ignoring millions of potential customers.
APAC: Managing Complexity Across Borders
Monitoring in the APAC region involves navigating extreme ISP fragmentation. Traffic between Tokyo, Singapore, and Sydney does not always follow a direct path. Furthermore, the "Great Firewall" creates a unique set of reachability challenges that a US or EU probe simply cannot replicate.
A service might be perfectly reachable from Singapore but completely blocked or throttled in other parts of the region. By distributing probes across these key Asian hubs, you can identify if a performance drop is a regional trend or a localized routing issue. This visibility is essential for maintaining high availability in the world's fastest-growing digital economy.
Quorum Rules: Eliminating the "Single-Region Blip"
Network noise is a reality of the public internet. A single probe in Singapore might fail to reach your server due to a localized BGP routing error, even if the rest of the world sees your site perfectly. If your alerting logic relies on that single node, you get a false positive. To prevent this, you must monitor multi-region probes — EU/US/APAC/SA PoPs; per-region timeline; quorum rules to suppress single-region blips.
Consensus is the core of reliability. Academic research into quorum-based failure detection confirms that requiring multiple independent witnesses is the most effective way to identify a true system state. In monitoring, this means an incident is only declared when a specific number of nodes agree that the target is down. It's a simple but powerful logic gate that protects your team from unnecessary 3 AM wake-up calls.
A Quorum Rule is a consensus-based alert validation mechanism that requires multiple independent monitoring nodes to confirm an outage before a notification is dispatched. This differentiates between a local probe failure and a genuine server outage. If one node sees a timeout but four others see a 200 OK, the system suppresses the alert. It's an honest approach to monitoring that acknowledges the fallibility of individual network paths.
How Quorum Logic Works in Practice
The process of validating an outage follows a logical sequence to ensure accuracy without sacrificing too much speed. Most uptime monitoring systems follow these three steps:
- Step 1: The primary probe assigned to the check detects a failure, such as a 404 error or a connection timeout.
- Step 2: The system immediately triggers secondary probes in other regions (e.g., switching from US-East to EU-Central and APAC-South) to verify the target.
- Step 3: An alert is only dispatched to your team if the defined quorum threshold is met by these secondary checks.
Customizing Thresholds for Your Stack
Sensitivity is a trade-off. If you set your quorum too high, you might delay the detection of a genuine global outage. If you set it too low, you risk false positives. For critical global services where any regional downtime is unacceptable, you might use an "Any Region" alert. This is useful for catching CDN misconfigurations that only affect one part of the world.
For most applications, a "Majority" logic like 2/3 or 3/5 is the gold standard. This suppresses regional ISP noise effectively. It ensures that your on-call engineer only gets paged when there is a high statistical probability that the service is actually down for a significant portion of your user base. Configuring these rules allows you to balance the need for rapid response with the necessity of a quiet, focused engineering environment.
The Per-Region Timeline: Visualising Latency and Outages
Binary monitoring is a relic. Knowing your site is "up" means nothing if users in São Paulo face 5-second load times while your London office sees lightning-fast responses. To truly understand global performance, you must monitor multi-region probes — EU/US/APAC/SA PoPs; per-region timeline; quorum rules to suppress single-region blips. A historical view reveals patterns that real-time dashboards often hide. It allows you to move beyond the binary state of availability and into the nuance of regional user experience.
Are your outages always starting in APAC? Does a specific infrastructure deployment trigger latency spikes in the EU? Visualizing these metrics over time allows you to move from reactive fire-fighting to proactive optimization. It transforms raw data into a narrative of your system health across the globe. You can pinpoint exactly when a change in your stack caused a degradation in a specific market. This level of detail is essential for maintaining a high-performance global application.
Latency Heatmaps vs. Linear Timelines
Heatmaps are popular in marketing decks but often insufficient for engineering teams. They provide a high-level overview but lack the granularity required for a rigorous Root Cause Analysis (RCA). A linear timeline allows you to see the "Ripple Effect" of an outage. You can watch as a failure in one PoP cascades through your network, identifying the exact origin of the disruption. This chronological clarity is vital for troubleshooting complex distributed systems.
It helps you identify whether a problem is a localized ISP issue or a systemic failure within your own stack. If the latency spike is isolated to a single SA PoP, the issue is likely regional routing. If it hits all pillars simultaneously, your origin server is the culprit. For practical tips on implementing these views, see our technical breakdown of API Monitoring: High Availability in 2026.
Data-Driven Incident Reports
Transparency is a competitive advantage. When things go wrong, a per-region timeline provides the evidence you need for an honest post-mortem. You can extract specific uptime percentages for different geographic markets to satisfy SLA requirements. This data is essential for holding cloud providers and CDNs accountable. If a provider claims high availability but your regional probes show a different story, you have the logs to back up your claim.
Stakeholders appreciate context. Telling a customer in Brazil that the outage was localized to North America changes the conversation entirely. It shows you have control over your global infrastructure. This data also serves as a leverage point when discussing performance issues with your providers. Using status pages with regional timelines ensures your users stay informed with precise, regional data. It eliminates the ambiguity of a generic "down" status and replaces it with technical certainty.
StatusPulse: Precision Monitoring for Modern Teams
Global observability shouldn't be a luxury reserved for massive corporations with bloated budgets. StatusPulse provides the technical infrastructure to monitor multi-region probes — EU/US/APAC/SA PoPs; per-region timeline; quorum rules to suppress single-region blips without the complexity of traditional enterprise tools. We built this platform for specialists who are tired of chasing false positives and navigating opaque pricing models. Our focus is on precision, transparency, and data sovereignty.
Integrity is at the core of our architecture. You choose where your data lives with a dedicated choice between EU or US hosting. Unlike industry incumbents that charge per-subscriber fees, we utilize a flat, transparent pricing model. This ensures you can scale your communication during an incident without worrying about a ballooning bill. It's a straightforward approach for teams that value ethical software and reliable metrics.
From Detection to Communication
Detecting a regional failure is only the first step. The real challenge is communicating that failure to your users before they flood your support inbox. StatusPulse bridges this gap by linking regional probe data directly to incident management. When a quorum threshold is reached, our AI assistant analyzes the per-region timeline to identify the scope of the impact. It then generates a draft incident update based on the specific technical data observed.
We prioritize human agency in every step of the process. The AI acts as an assistant, not an autonomous agent. It suggests a clear, concise status message, but your engineers have the final word. You review, edit, and publish the update when you are ready. This workflow ensures that your status page remains an honest reflection of your system state without adding to the team's cognitive load during a crisis.
Getting Started with Global Visibility
Setting up your first multi-region monitor is a straightforward process that takes under 2 minutes. You simply define your target, select your preferred PoPs across our global pillars, and configure your quorum sensitivity. There is no "enterprise bloat" to navigate; you get immediate access to the tools you need to protect your uptime.
StatusPulse fits into your existing stack rather than forcing you to change it. We provide native integrations with Slack, PagerDuty, and custom webhooks to ensure your team is notified wherever they already work. If you are looking for a monitoring partner that values technical depth over marketing flash, we are ready to help. You can start monitoring with StatusPulse for free and see the difference that consensus-based alerting makes for your on-call rotation.
Building a Reliable Global Monitoring Stack
Reliability is not the result of luck. It's the outcome of intentional technical choices. Moving away from single-region checks reduces the noise that leads to engineering burnout. You need a system that prioritizes consensus over localized network blips. By choosing to monitor multi-region probes — EU/US/APAC/SA PoPs; per-region timeline; quorum rules to suppress single-region blips, you ensure that every alert is backed by statistical certainty. This approach builds trust with your global customers and provides your team with the data they need for rigorous root cause analysis.
Your monitoring tools should be assistants, not sources of stress. StatusPulse combines consensus-based alert logic with AI-assisted incident management to streamline your response. With a firm commitment to EU-based privacy and transparent pricing, we provide a principled alternative to complex enterprise bloat. Stop the false alerts. Switch to StatusPulse Multi-Region Monitoring.
Start small, configure your thresholds, and reclaim your sleep. A more resilient global monitoring strategy is within reach.
Frequently Asked Questions
What are multi-region probes in uptime monitoring?
Multi-region probes are independent monitoring nodes situated in diverse geographic data centers across the globe. These nodes simulate user traffic from specific locations like the US, EU, APAC, or South America. By checking your service from multiple global entry points, they identify regional routing issues or localized outages that a single-region check would miss. This ensures your dashboard reflects the actual experience of a distributed user base.
How do quorum rules prevent false uptime alerts?
Quorum rules prevent false alerts by requiring a consensus among multiple monitoring nodes before an incident is declared. Instead of paging you based on one failed check, the system verifies the status from other regions. This logic effectively filters out transient network noise or localized ISP failures that don't reflect the actual availability of your origin server. It ensures your on-call team only reacts to genuine service disruptions.
Why should I monitor my website from South America (SA)?
Monitoring from South America is essential because routing from the Northern Hemisphere to regions like Brazil or Argentina involves complex transcontinental hops. A "Green" status in a US-East data center doesn't guarantee your site is reachable for LATAM users. Local SA probes capture regional BGP leaks and ISP-specific outages that other pillars cannot detect. It's a critical requirement for any business with a growing footprint in the Southern Hemisphere.
Can multi-region monitoring detect CDN-specific outages?
Yes, multi-region monitoring is the most effective way to identify CDN-specific outages or misconfigurations. If your service is unreachable in APAC but healthy in the US and EU, the issue likely resides in the CDN's regional edge nodes or WAF rules. A per-region timeline helps you pinpoint which geographic clusters are affected. This data allows you to hold your providers accountable and provides a clear starting point for troubleshooting.
What is the difference between a regional blip and a global outage?
A regional blip is a localized network disruption affecting a specific geographic path, often caused by ISP routing errors or localized hardware failure. A global outage occurs when your origin server or primary database fails, making the service unreachable from all monitoring pillars. You should monitor multi-region probes — EU/US/APAC/SA PoPs; per-region timeline; quorum rules to suppress single-region blips to distinguish between these two states accurately.
How many monitoring regions do I need for a global SaaS?
For a global SaaS, you generally need at least four core monitoring pillars: North America, Europe, Asia-Pacific, and South America. This distribution ensures you cover the major internet backbones and peering points. While adding more nodes within these regions can increase detection speed, these four pillars provide the baseline visibility required for an accurate global uptime report. It balances comprehensive coverage with the need for a quiet, focused alerting environment.
Does multi-region monitoring increase the cost of uptime checks?
Cost structures vary significantly between providers. Some legacy platforms charge per individual test run, which can become expensive as you add regions and increase check frequency. Other providers offer flat pricing models that include global PoPs without per-check surcharges. You should evaluate whether a provider charges "enterprise premiums" for regional nodes or if they offer transparent, all-in pricing that supports data sovereignty and global coverage.
How does StatusPulse handle single-region probe failures?
StatusPulse uses native quorum logic to handle single-region failures without triggering false positives. When a probe in one region detects an error, the system immediately verifies the target from secondary PoPs. If the majority of nodes see the service as healthy, the alert is suppressed. The event is logged as a localized blip on your timeline, allowing you to track regional performance without waking up your engineering team for a non-event.


