Your TCP connection is healthy, but your service logic is dead. This silent failure is the "zombie pod" problem that standard probes often miss. Relying on basic uptime checks leaves your system vulnerable to application-level crashes that don't trigger a network disconnect. Effective gRPC Health Monitoring Using Check and Watch over HTTP/2 and HTTP/3 requires moving beyond simple pings to actual protocol-level awareness.
We know the stress of seeing "green" dashboards while users report errors. You will learn to implement the official gRPC Health Checking Protocol to gain granular visibility. We cover the setup of unary Check methods for point-in-time validation and streaming Watch methods for real-time updates. This guide also compares transport layers, specifically how HTTP/3 (RFC 9114) handles packet loss better than HTTP/2 by eliminating head-of-line blocking. You'll finish with a working implementation that connects internal signals to automated status updates.
Key Takeaways
- Move beyond standard HTTP 200 OK checks to capture internal service logic failures using the standardized gRPC Health Checking Protocol.
- Implement gRPC Health Monitoring Using Check and Watch over HTTP/2 and HTTP/3 to balance periodic point-in-time validation with real-time streaming updates.
- Learn how HTTP/3 eliminates TCP head-of-line blocking to ensure health signals remain reliable even during periods of heavy network congestion.
- Configure native Kubernetes liveness and readiness probes for version 1.24+ to monitor container health without relying on external binaries.
- Automate the bridge between internal health signals and public status pages to maintain transparency with users during service disruptions.
Beyond the 200 OK: The gRPC Health Checking Protocol
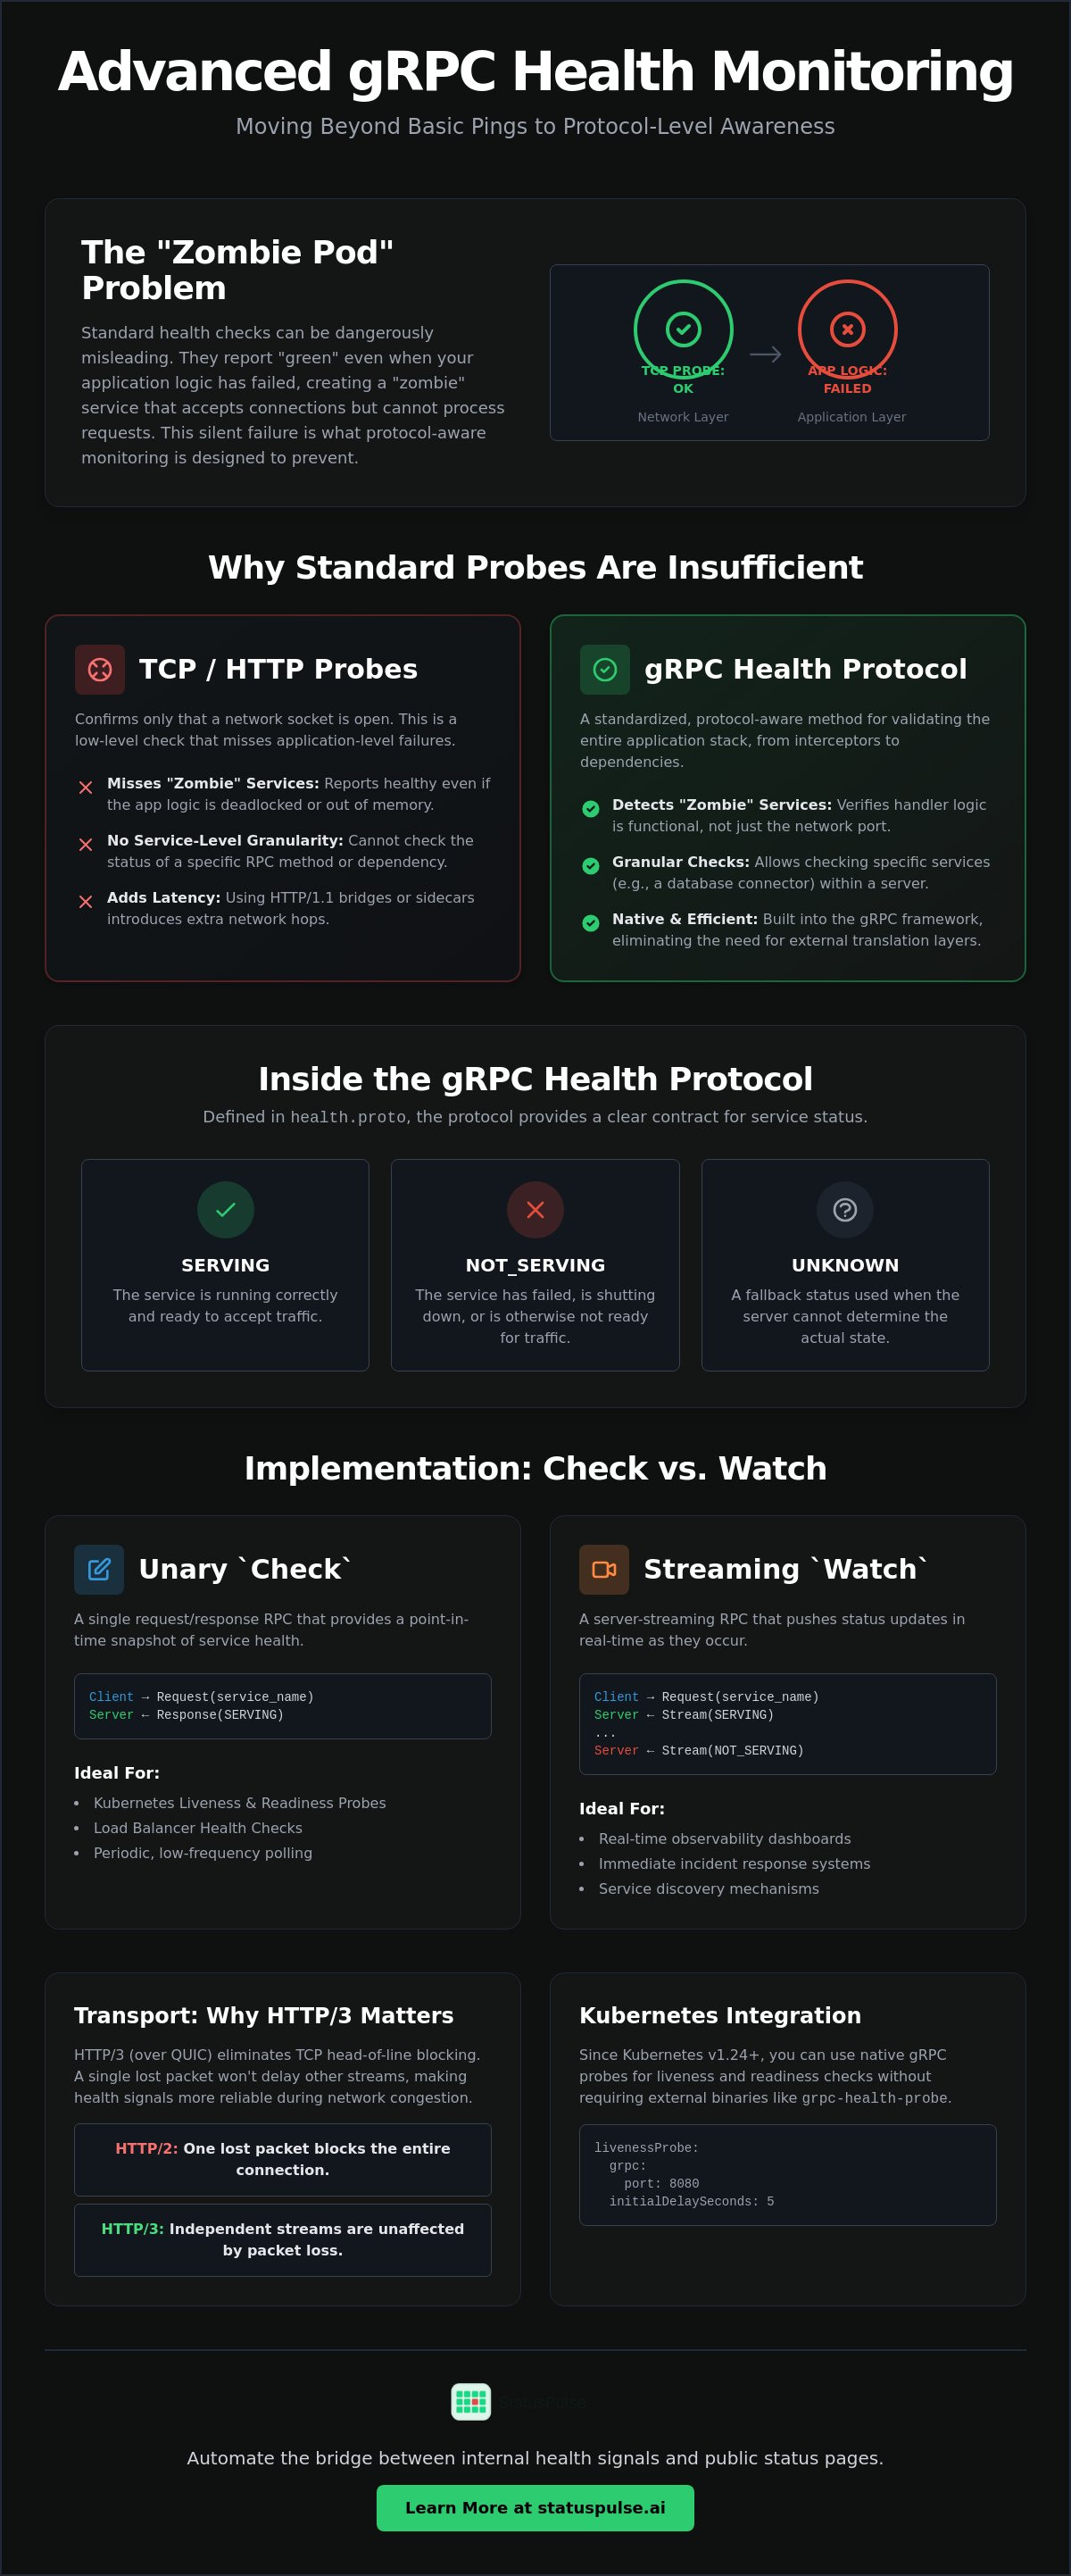
Standard HTTP health checks often fail to capture the internal state of a gRPC server. They usually check if the web server process is running, but they ignore the health of the underlying logic. For distributed systems, a simple "up" status is often a binary lie. Real reliability requires protocol-level awareness. Implementing gRPC Health Monitoring Using Check and Watch over HTTP/2 and HTTP/3 ensures your monitoring reflects the actual ability of the service to handle complex RPC calls.
Using HTTP/1.1 bridges or sidecars for health checks introduces unnecessary latency. It adds another network hop and complicates the troubleshooting path. The gRPC Health Checking Protocol is a standardized service for reporting server status directly through the framework itself. The Health service is a proto-based contract for liveness that eliminates the need for external translation layers or complex proxy configurations. It moves health signal logic directly into the application where it belongs.
The Health.proto Definition
The protocol relies on a simple protobuf definition found in grpc/health/v1/health.proto. It defines two core messages: HealthCheckRequest and HealthCheckResponse. The request includes a service string parameter. This allows for granular per-method health tracking. You can check if the entire server is functional or just a specific component, such as a database connector or a cache layer. This precision is essential for complex microservices.
The ServingStatus enum provides three core states. SERVING means the service is ready for traffic. NOT_SERVING indicates a failure or an intentional shutdown process. UNKNOWN acts as a fallback for when the state cannot be determined. This clarity prevents the ambiguity found in generic HTTP error codes. It allows gRPC clients to make informed load-balancing decisions based on actual service readiness.
Why TCP Probes Are Insufficient
Many legacy systems rely on TCP probes to determine health. These only confirm that the transport layer is active. A TCP handshake succeeds even if the application logic is deadlocked or out of memory. This creates the "Zombie Service" problem. The process is running, but it cannot process RPCs. Your monitoring system thinks everything is fine while your users experience total failure.
Protocol-level checks validate the entire application stack. They verify that the handler logic, interceptors, and underlying dependencies are functional. By using gRPC Health Monitoring Using Check and Watch over HTTP/2 and HTTP/3, you detect failures that occur above the network layer but below the monitoring threshold. This grounded approach to health signals reduces the stress of technical disruptions by providing honest data from the heart of the service.
Implementing Check vs. Watch Methods
The choice between polling and streaming determines how quickly your system responds to a failure. While the previous section defined the protocol, the actual implementation requires choosing between the Unary Check and the Server-Streaming Watch methods. Effective gRPC Health Monitoring Using Check and Watch over HTTP/2 and HTTP/3 balances these two patterns based on the specific consumer of the health signal.
Managing state transitions is the core responsibility of the server. When a dependency fails, the server must transition from SERVING to NOT_SERVING and notify all active listeners. This logic must be lightweight. If your health check logic is too heavy, it becomes a performance bottleneck itself. You're trying to monitor the service, not contribute to its exhaustion.
Unary Check: Best Practices for Load Balancers
The Check method is a standard Unary RPC. It provides a point-in-time snapshot of the service. This is the ideal choice for Kubernetes readiness probes or external load balancer heartbeats that operate on fixed intervals. Because it's a single request-response, it doesn't require maintaining long-lived state on the server side.
Deadlines are critical here. You should set a tight timeout for health RPCs. If a health check takes five seconds to respond, the service is likely already degraded. Additionally, your implementation must handle the NOT_FOUND status. This occurs when a client requests health for a specific service name that isn't registered on the server. For a comprehensive look at handler setup, gRPC health checks in ASP.NET Core offers excellent implementation patterns for these scenarios.
Streaming Watch: Real-time Observability
The Watch method uses a Server-Streaming RPC to push updates. Instead of the client asking "are you okay?" every few seconds, the server says "I'll let you know if anything changes." This significantly reduces the time to detect service degradation. It eliminates the "blind spot" between polling intervals.
Implementing Watch requires a server-side loop or an observer pattern to monitor internal dependencies like database connection pools or available disk space. When a change occurs, the server pushes a new HealthCheckResponse through the open stream. On the client side, you must implement robust reconnection logic. Use exponential backoff to ensure that a fleet of clients doesn't overwhelm a recovering server after a network blip. For teams looking to bridge these internal signals to a public presence, integrating these metrics with uptime monitoring ensures your status page stays as accurate as your backend.
Implementation Trade-offs
There is no free lunch in monitoring. Watch streams reduce network noise and detection latency, but they increase memory overhead because the server must track every active subscriber. Conversely, frequent Unary Check calls increase CPU usage due to repeated header compression and decompression. In an HTTP/2 environment, multiplexing helps, but the overhead of repeated requests still exists. HTTP/3 further refines this by making these streams independent, which we will explore in the next section.
Transport Evolution: Monitoring over HTTP/2 vs. HTTP/3
HTTP/2 has been the backbone of gRPC since its inception. It introduced multiplexing, allowing multiple health signals to travel over a single TCP connection. This efficiency was a massive step up from the overhead of HTTP/1.1. However, TCP has a fundamental flaw known as Head-of-Line (HOL) blocking. If one packet is lost, the entire connection waits for retransmission. In a monitoring context, your health check might time out simply because an unrelated data stream lost a packet. This creates false positives that trigger unnecessary alerts.
HTTP/3 and QUIC change this dynamic. By moving to a UDP-based transport, gRPC gains resilience in lossy networks. gRPC Health Monitoring Using Check and Watch over HTTP/2 and HTTP/3 behaves differently depending on this underlying layer. HTTP/3 eliminates head-of-line blocking by treating each gRPC stream as an independent unit within the QUIC transport layer, preventing a single lost packet from stalling the entire connection. This makes your monitoring signals far more reliable when network conditions degrade or congestion occurs.
Multiplexing and Stream Priority
In HTTP/2, you must be careful with flow control. If your data streams saturate the connection, your health check signals might get delayed. You can mitigate this by assigning high priority to health streams. This ensures they move to the front of the queue during congestion. gRPC manages this through internal flow control windows, but the shared nature of TCP still poses risks. You don't want a large file upload to hide a service failure.
QUIC simplifies this by integrating TLS 1.3 directly into the transport handshake. This reduces the overhead compared to TLS over TCP. You get faster connection establishment and better recovery from packet loss. For a deep look at how these probes interact with orchestration layers, see Health checking gRPC servers on Kubernetes. It remains a foundational resource for understanding probe mechanics before moving to more advanced transport protocols.
Data Sovereignty and Regional Monitoring
Latency is the enemy of accurate health checks. If you monitor an EU-based service from a US-based probe, you're measuring the Atlantic Ocean as much as your application. High latency can trigger false negatives in your Check calls. This is why we prioritize regional monitoring. It matches the actual user experience by placing probes where your traffic originates.
At StatusPulse, we offer a choice between EU and US hosting. This isn't just about speed; it's about ethics and data sovereignty. We ensure monitoring probes comply with GDPR by staying within EU boundaries when required. You shouldn't have to sacrifice privacy for performance. By monitoring from the same region where your data lives, you get a truthful view of your service health without the noise of long-distance network jitter. It's a straightforward approach for teams that value precision.
Practical Integration: Kubernetes and Probes
Kubernetes v1.27 made native gRPC probes Generally Available, fundamentally changing how we handle service reliability. Before this, we relied on the grpc-health-probe binary. This required bundling a separate executable in every container image, increasing the attack surface and image size. Native probes allow the kubelet to communicate directly with your service using the protocol. This streamlines gRPC Health Monitoring Using Check and Watch over HTTP/2 and HTTP/3 by removing the middleman.
If you're running on a cluster older than v1.24, the grpc-health-probe tool is still your primary option. It's also useful for complex check logic that requires custom environment variables or specific authentication headers that the native kubelet probe doesn't yet support. However, for most modern deployments, the native field is the cleaner path. It reduces operational overhead and matches the efficiency of the gRPC framework itself.
Configuring Native gRPC Probes
Implementing a native probe is a three-step process. First, ensure your server exposes the health service on a port. This can be your main application port or a dedicated administrative port. Dedicated ports are often safer as they allow you to isolate health traffic from user requests. Second, define the probe in your YAML manifest using the grpc field. Finally, tune your timing parameters to match your application's actual startup behavior.
livenessProbe:
  grpc:
port: 9000
service: "account-service"
  initialDelaySeconds: 10
  periodSeconds: 15
Setting initialDelaySeconds correctly prevents Kubernetes from killing your pod while it's still initializing its database connections or cache. A periodSeconds value of 15 is a common starting point. It's frequent enough to catch failures quickly but slow enough to avoid unnecessary CPU cycles on the server.
Monitoring Sidecars and Proxies
Service meshes like Istio or Linkerd use Envoy proxies to manage traffic. Envoy can be configured to filter gRPC health checks, ensuring that only valid probes reach your application. This is where the "double-ping" problem occurs. If your Ingress controller probes the proxy and the proxy probes the server, a failure in the proxy looks like a server crash. To avoid this, point your liveness probes directly at the application container while using readiness probes to validate the entire network path.
For teams managing clusters across multiple regions, manually syncing these Kubernetes events to a public dashboard is a chore. You can use API monitoring to bridge your internal gRPC health signals directly to a transparent status page. This ensures your users see the same truth your SREs see, without the bloat of traditional enterprise monitoring tools or complex pricing models. It's a direct way to maintain trust during technical disruptions.
Service Mesh Traffic Management
Integrating health signals with your service mesh allows for automated traffic shifting. When a gRPC Watch stream reports a NOT_SERVING status, the mesh can immediately stop sending traffic to that specific pod. This happens much faster than a standard Kubernetes endpoint update. By combining protocol-level awareness with mesh-level control, you eliminate the latency between a failure and its mitigation. This is the foundation of high availability in modern distributed systems.
From Health Signals to Incident Transparency
Technical health checks are the foundation of honest incident communication. A NOT_SERVING status shouldn't stay trapped in a Prometheus dashboard. It represents a real problem for a real person. By using gRPC Health Monitoring Using Check and Watch over HTTP/2 and HTTP/3, you create a direct pipeline from your backend's reality to your customer's expectations. This transparency prevents the frustration of "silent failures" where a service is broken but the status page claims 100% uptime.
We believe in a grounded approach to reliability. Monitoring shouldn't just be about internal alerts; it's about reducing the stress associated with technical disruptions. When your monitoring signals are protocol-aware, your incident reports become more accurate. You stop guessing about the state of your system and start communicating with quiet confidence. This honesty is what builds long-term trust with your users.
Bridging gRPC to Public Status Pages
Integrating internal gRPC signals with uptime monitoring allows for automated incident creation. When a streaming Watch method detects a state change, it can trigger an immediate alert. This reduces the "mean time to notify." You shouldn't wait for a manual report to update your users. A failed health signal is a signal to be transparent.
Setting up specific alerting thresholds is a best practice. It prevents "flapping" status updates where a momentary network blip on an HTTP/2 connection triggers a public incident. By requiring a sustained failure over several Check cycles, you ensure your public communications remain reliable and noise-free. This precision is why protocol-aware monitoring is superior to generic pings. It filters out the noise so you can focus on the signal.
AI-Powered Incident Management
Incident management often leads to developer burnout. Drafting the first update during a crisis is a high-stress task. Our AI incident management tools analyze gRPC error codes and health responses to suggest root cause summaries. If the Watch stream fails with a specific dependency error, the AI can draft an explanation that non-technical users can actually understand. This keeps your team focused on the fix rather than the formatting.
We prioritize human agency in this process. The AI acts as an assistant, preparing the technical context and the public message, but the final "publish" action remains human-led. This ensures that your brand voice stays authentic while your response speed stays fast. Maintaining a meticulous record of these health signals also simplifies SLA reporting. You move from guessing about downtime to having a verifiable audit trail based on the gRPC protocol itself. It's a straightforward way to prove your commitment to uptime.
Build a Resilient Monitoring Strategy
Implementing protocol-aware health checks is no longer optional for high-availability systems. You've seen how native Kubernetes probes and the gRPC Health Checking Protocol eliminate the "zombie service" problem. By adopting gRPC Health Monitoring Using Check and Watch over HTTP/2 and HTTP/3, you ensure that your monitoring signals remain reliable even under heavy network congestion. The transition from internal technical signals to external transparency is the final step in a mature SRE practice. It bridges the gap between binary code and human trust.
We built StatusPulse for specialists who value precision over corporate bloat. You can choose between EU or US hosting to maintain strict data sovereignty while using AI-powered drafting to simplify your incident response. We offer flat, transparent pricing with no per-subscriber fees. This ensures your costs stay predictable as your user base grows. You get a tool that is as straightforward as the systems you build.
Automate your incident communication with StatusPulse. Your users deserve honesty, and your developers deserve a workflow that respects their time. Start building a more transparent future today.
Frequently Asked Questions
What is the difference between gRPC Check and Watch methods?
The Check method is a Unary RPC used for point-in-time health validation. It returns a single response indicating the current status of the service. The Watch method is a Server-Streaming RPC that keeps a connection open to push status changes in real-time. Use Check for periodic infrastructure probes. Use Watch for clients that need immediate notification of service degradation without the latency of polling.
Does gRPC health monitoring work over HTTP/3?
Yes, gRPC is fully compatible with HTTP/3 and the QUIC transport protocol. Implementing gRPC Health Monitoring Using Check and Watch over HTTP/2 and HTTP/3 is highly effective because HTTP/3 eliminates head-of-line blocking. If a data packet is lost, your health check stream remains unaffected. This ensures that monitoring signals stay reliable even during periods of heavy network congestion or packet loss.
Is it better to use a separate port for gRPC health checks?
Using a separate port provides better isolation between your application logic and your monitoring signals. It prevents health checks from being delayed if the main application port is saturated with heavy traffic. This setup also allows you to apply stricter firewall rules to your administrative endpoints. While it adds slight configuration complexity, it results in a more truthful representation of service availability under load.
How does Kubernetes handle gRPC liveness probes natively?
Kubernetes handles these probes natively through the kubelet, which communicates directly with the gRPC Health Checking Protocol. You define a grpc field in your pod manifest and specify the target port. This feature became Generally Available in Kubernetes v1.27. It removes the need to bundle external binaries like grpc-health-probe in your container images, which reduces your security attack surface and image size.
Can I use gRPC health checks for readiness probes?
Yes, gRPC health checks are a standard tool for readiness probes. They ensure a pod only receives traffic when its internal dependencies, such as database connections, are fully initialized. By returning a NOT_SERVING status during startup, you prevent your load balancer from sending requests to an unready pod. This is significantly more reliable than a simple TCP check, which only confirms the port is open.
What is the performance overhead of the gRPC Watch method?
The primary overhead of the Watch method is the memory required to maintain long-lived streams for each subscriber. Each open connection consumes server resources. However, it is often more efficient than high-frequency polling because it eliminates the CPU cost of repeated header compression and decompression. For most distributed systems, the benefit of real-time failure detection outweighs the minimal memory footprint of the open streams.
How do I monitor gRPC health if my service is behind a proxy?
Your proxy or Ingress controller must be configured to support gRPC and HTTP/2 or HTTP/3 traffic. Modern proxies like Envoy can be configured to pass health check requests directly to the backend service. It is best practice to point liveness probes at the application container and readiness probes at the proxy. This strategy helps you distinguish between an application crash and a network path failure between the proxy and the server.
How can I connect gRPC health checks to a public status page?
You can connect your internal gRPC Health Monitoring Using Check and Watch over HTTP/2 and HTTP/3 to a public status page by using a monitoring agent as a bridge. The agent subscribes to your health signals and pushes status updates to your page provider via an API. This ensures your public incident communication is based on the actual protocol-level health of your services. It eliminates the delay between a backend failure and a user-facing update.