

Your homepage returns HTTP 200, but the checkout API is failing. A basic uptime check says everything is fine. That gap is why endpoint availability monitoring needs to test the routes and behaviors users rely on, not just whether a server responds.
A simple check is a useful starting point, but it can miss broken application behavior or generate noise when a transient network issue looks like an outage. Use signals that distinguish reachability from latency and functional correctness, then define alert rules that help teams decide when to act. This guide explains how to choose checks based on endpoint purpose and user impact, validate results without overreacting to noisy probes, and connect detection to clear incident updates. The aim is practical: know when a specific endpoint is unavailable to users, and communicate what’s affected without adding confusion.
Key Takeaways
- Check critical application routes, not just the homepage, to see whether the services users rely on are responding.
- Use HTTP status, response time, and content checks as separate signals; each reveals a different kind of failure.
- Choose endpoint availability monitoring checks that match the endpoint’s purpose, define expected behavior, and assign an owner.
- Combine endpoint checks with infrastructure monitoring, logs, or synthetic transactions when you need broader context or user-flow validation.
- Use verified failures to guide triage and customer updates, but investigate impact and root cause separately.
What endpoint availability monitoring measures, and what it does not
A homepage returns HTTP 200 after a deployment, but the API route that loads account data returns errors. The site appears up, yet users can’t reach a critical part of the application. Endpoint availability monitoring exposes this gap by checking whether a specified application or API interface responds according to defined criteria.
That signal has limits. A check describes an endpoint at a particular time and from a particular test setup. An uptime percentage summarizes results across a period, but doesn’t explain every failure. Latency measures how long a response takes, while functional correctness asks whether the application produced the right result. These measures inform each other, but they aren’t interchangeable.
What counts as an endpoint in an availability check?
An endpoint could be a website route such as /account, an API resource such as /v1/orders, or a health endpoint designed to report service status. Each URL or interface should have a clear operational purpose. Otherwise, a green check may provide little evidence about the service users depend on.
A lightweight health endpoint can confirm that a service process is responding, but it may not test a user-facing transaction. For example, it might return “healthy” while a database query or checkout step is failing. Monitor health endpoints for basic service signals, and select transaction routes when you need to test a more user-relevant path.
Availability, latency, and correctness are different signals
Availability means a check met its configured success criteria. Those criteria might include receiving an expected HTTP status code, finding specific content, or completing a request before a timeout. A successful HTTP response alone isn’t proof that the application behaved correctly. A route can return a normal status while serving an error message, stale data, or an incomplete response.
Latency is the time taken to receive a response. A check can pass availability criteria but still be slow, so assess response time separately against the service’s needs. Content assertions can catch some incorrect responses, but they don’t prove that a multi-step workflow works end to end.
Reachability shows that an endpoint responds; end-to-end correctness shows whether the user’s intended task succeeds. Choose the signal that matches the question you need to answer. For broader context, Network monitoring covers the related practice of observing network components for availability and performance issues.
This section concerns application and API endpoints. It doesn’t cover employee-device security monitoring, which focuses on the health and protection of laptops, phones, and other user devices.
How endpoint availability checks detect failures
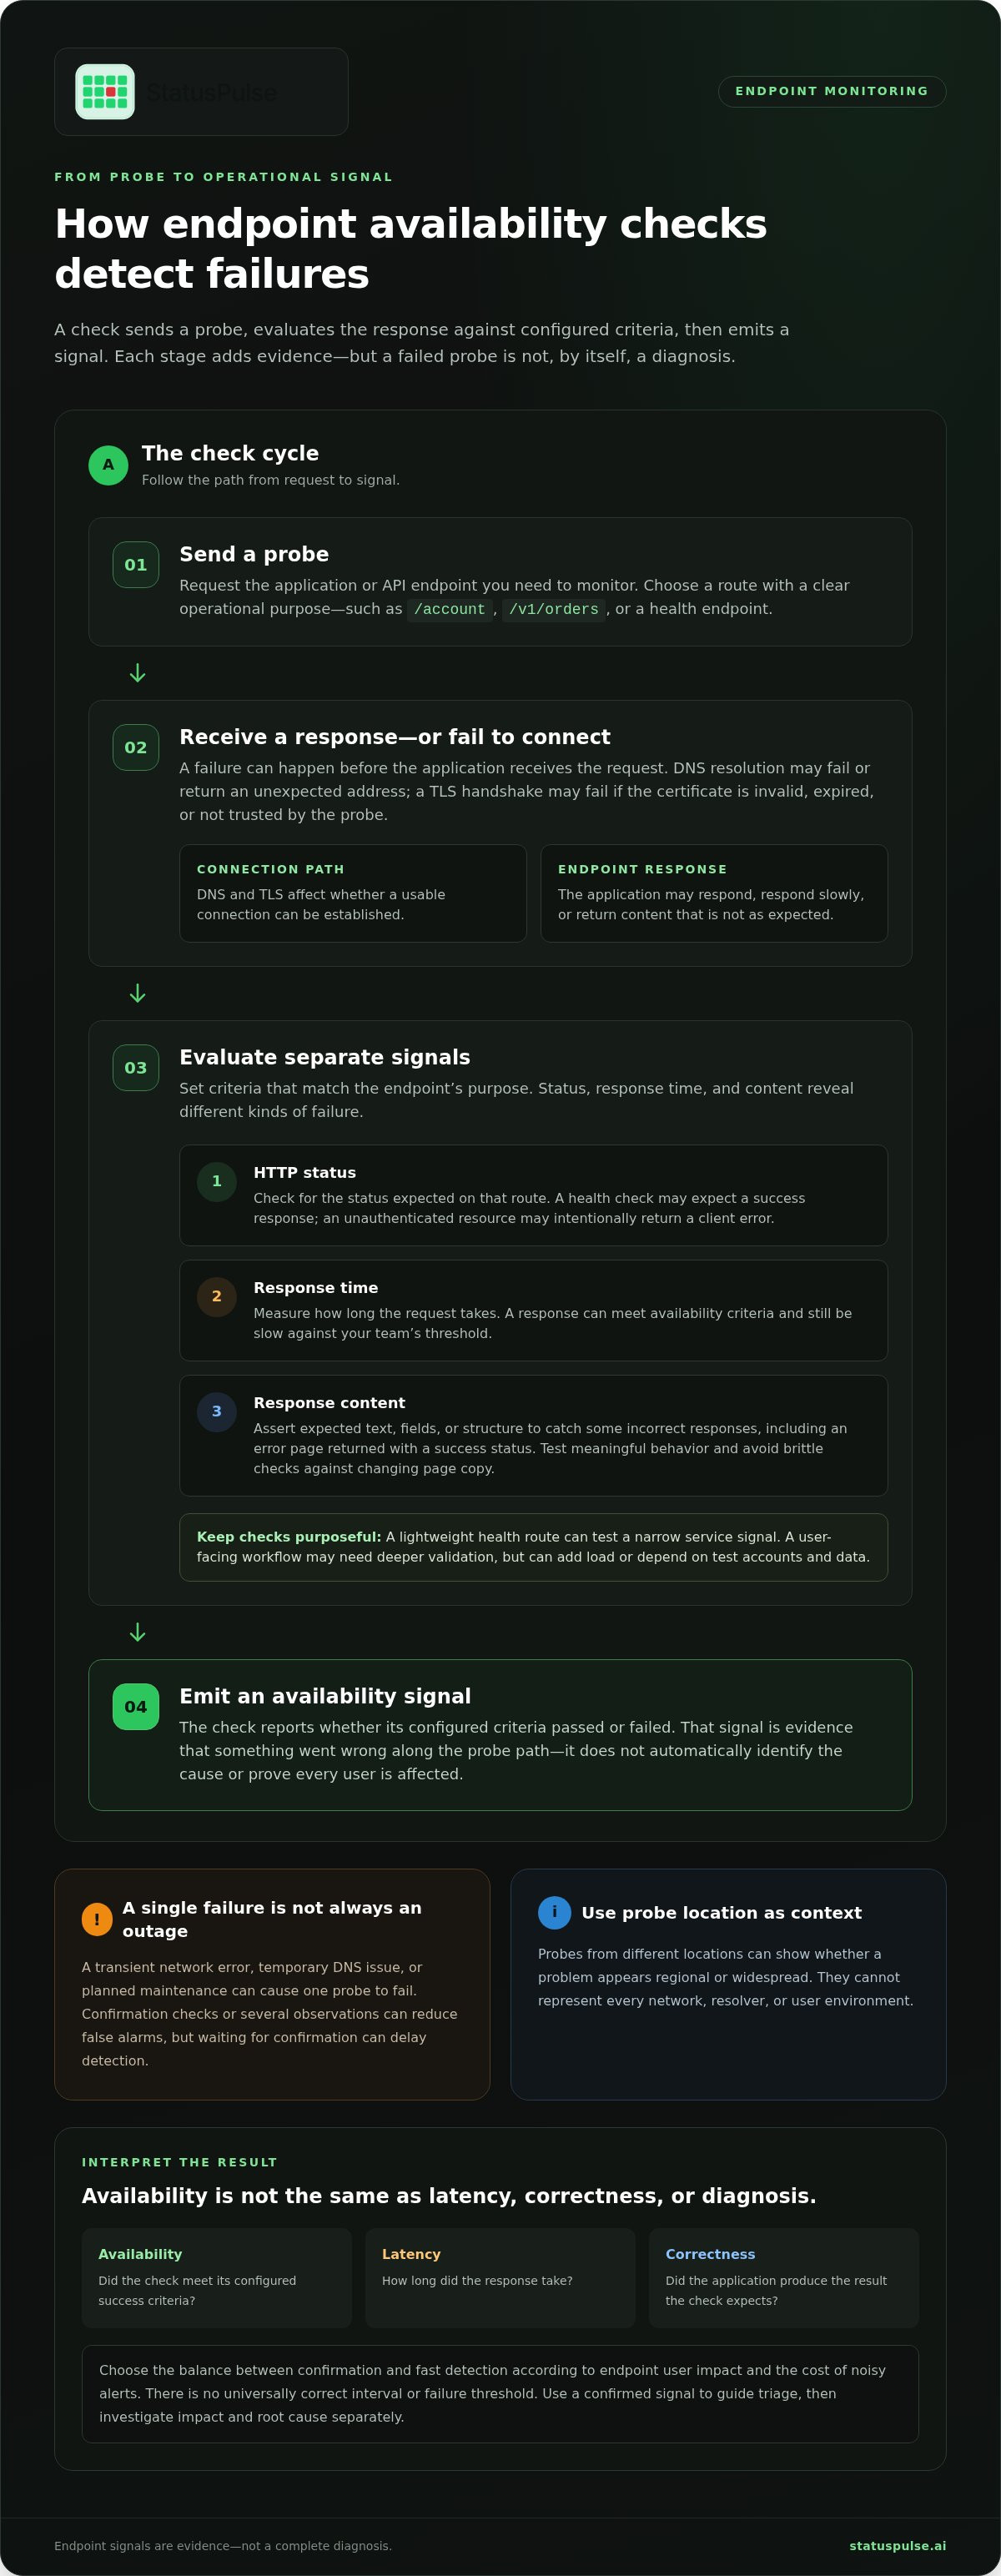
An endpoint check follows a simple cycle: send a probe, receive or fail to receive a response, evaluate the result against configured criteria, then emit a signal. A failed signal is evidence that something went wrong along that path. It doesn’t automatically identify the cause or prove that every user is affected.
In endpoint availability monitoring, separate evidence helps teams interpret the result:
- HTTP status: Shows how the server answered. An unexpected status can indicate a failure, but the expected code depends on the route. A health check may expect a success response, while an unauthenticated resource might intentionally return a client error.
- Response time: Measures how long the request took. A slow response may breach a team’s own threshold even when the server eventually returns a success status.
- Response content: Checks for expected text, fields, or structure. This can catch an error page returned with a success status, but only if the assertion tests meaningful behavior.
Reachability can also fail before the application receives the request. DNS resolution may return an error or an unexpected address. A TLS handshake can fail because the certificate is invalid, expired, or not trusted by the probe. These failures affect whether a client can establish a usable connection, even if the application process itself is running.
What should a useful endpoint check validate?
Start with the response code that fits the endpoint’s purpose, then add only checks that answer a real operational question. A body assertion might verify that a health route reports dependencies as ready, for example. Avoid brittle checks against changing page copy. Keep a lightweight health route test narrow; a user-facing workflow may need deeper validation, but can add load or depend on test accounts and data.
Why one failed probe may not prove an outage
A transient network error, temporary DNS issue, or planned maintenance can cause a single probe to fail. A confirmation check or several observations can reduce false alarms, though waiting for confirmation can delay detection. Set the balance according to the endpoint’s user impact and the cost of noisy alerts. There’s no universally correct interval or failure threshold.
Probes from different locations can reveal whether a problem appears regional or widespread. They still can’t represent every network, resolver, or user environment. Treat location as useful context, not proof that all users share the same experience.
A confirmed availability signal is one input to triage, not a diagnosis. IBM’s overview of incident response covers response planning more broadly; service monitoring teams still need to assess impact and cause. Cloud-based uptime and API monitoring can connect endpoint signals with status pages and incident communication.
How endpoint availability monitoring compares with adjacent tools
Endpoint checks answer a focused question: did an external probe get the expected response from this service interface? Other tools answer different questions. Infrastructure metrics show resource conditions, logs record events, and synthetic transactions test a sequence of user actions. Treat these signals as complementary, not interchangeable.
| Method | Signal it provides | Common blind spot | Suitable use |
|---|---|---|---|
| Endpoint check | Observed response from a specific route or API | Limited context about why a request failed | Detecting reachability or response changes |
| Infrastructure monitoring | Resource metrics such as CPU, memory, or disk use | Healthy resources don’t prove users can reach the service | Finding host or resource pressure |
| Logs | Application and system events around a request | Events alone don’t establish external availability | Investigating errors and reconstructing activity |
| Synthetic transaction | Result of a scripted, multi-step journey | More complex to maintain; may not represent every user path | Validating workflows that depend on several actions |
Endpoint checks versus infrastructure and log monitoring
An endpoint probe observes service behavior from its own vantage point. Infrastructure monitoring looks inward at components such as a host’s CPU and memory. A server can have spare capacity while a route fails because of an application error, or the route can respond while resource pressure degrades other requests.
Logs add context for investigation. They may show exceptions, failed dependencies, or request details, but they don’t independently prove what an external user could reach. Use the endpoint signal to detect a symptom, then correlate it with metrics and logs to narrow the cause. Microsoft’s guidance on health check endpoints also explains how applications can expose health information to infrastructure such as load balancers and orchestrators.
When endpoint checks are not enough
Use a synthetic transaction when service availability depends on several actions, such as signing in, submitting a request, and receiving the expected result. A single route check can’t validate that full journey. Synthetic tests give stronger workflow evidence, but require careful handling of test data, accounts, and state.
When a failure crosses service boundaries, tracing or broader observability can help locate where a request stalled or failed. For API-specific monitoring, see the API monitoring information. Add the tools that answer your operational question; more signals help only when the team can interpret and act on them.
How to design endpoint checks and alerts that teams can trust
Reliable endpoint availability monitoring starts with a question: which failure would affect users or dependent services? Choose checks and alert rules around that risk, then review whether they still reflect how the service works. Defaults can be a starting point, not a substitute for understanding the endpoint.
Choose endpoints that represent real user impact
Prioritize routes tied to core user journeys or critical dependencies. A small set of well-chosen checks can offer more useful coverage than monitoring every route without a clear purpose. A health endpoint may represent basic service readiness; a user-facing route can test a specific capability.
For each check, document its owner, expected behavior, and limits. State what a passing result proves, such as successful access to a particular API resource, and what it cannot detect, such as a failure in an untested workflow.
Turn failed checks into actionable alerts
Send alerts to the team responsible for investigating the endpoint. Set failure conditions and confirmation behavior based on service risk, observed response patterns, and the cost of a delayed or noisy alert. A detection signal should prompt investigation; it doesn’t, by itself, establish customer impact or declare an incident.
Use this sequence to build or review a check:
- Select a user-critical endpoint and name its owner.
- Define success: expected status, relevant response content, and acceptable response time.
- Test the criteria against normal responses and known failure cases.
- Route alerts to the responsible team and make the failure details clear.
- Review the check after service changes or noisy alerts.
Illustrative HTTP check using curl: This example requests a health route, fails on HTTP error responses, and prints the status code and total response time. Replace the example host with the endpoint you intend to test. It illustrates a single request, not a complete alerting policy.
curl --fail --silent --show-error \
  --output /dev/null \
  --write-out 'status=%{http_code} time=%{time_total}s\n' \
  https://api.example.com/health
A passing command confirms only that this request met curl’s transport and HTTP error conditions. Add application-specific validation where it provides meaningful evidence, and avoid treating one result as proof that every user can complete a workflow.
For broader reliability practices, use a consistent process to review endpoint scope, failure criteria, and alert ownership. Explore uptime monitoring alongside public status pages and incident management in one platform.
Connect endpoint monitoring to incident response and clear updates
A failed endpoint check is a starting signal, not a full incident report. Verify the failure, identify the affected service and route, then assess whether users or dependent systems are affected. Monitoring can show that a configured check failed, but it can’t establish the incident’s full scope or root cause on its own.
Use a clear operational path: confirm the signal, route it to the team responsible, investigate related services and telemetry, assess user impact, and communicate confirmed facts. For example, if an order API check fails, determine whether order submission is affected before describing the incident as a checkout outage. Update the assessment as evidence changes.
What to communicate after an endpoint failure
Tell users which service is affected and describe the confirmed impact in plain language. Separate what you know from what the team is still investigating. If the cause or recovery time is uncertain, say so rather than publishing a guess or promise.
A public status page gives customers a shared place to read verified impact and progress. Keep updates factual and revise them when the investigation confirms a change. For more guidance, see our article on transparent incident communication.
Where an integrated monitoring and status workflow helps
Keeping monitoring, public status pages, and incident management in one workflow can reduce handoffs between detecting a problem and preparing an update. It doesn’t remove the need for investigation or judgment. An endpoint failure still needs human review before the team declares customer impact or publishes a status.
AI-assisted incident management can help draft or summarize incident information, but people should verify the details before sharing them. Human review matters: an automated summary may not distinguish confirmed impact from an early hypothesis.
StatusPulse brings uptime and API monitoring, public status pages, and AI-assisted incident management together in one platform. The goal is a clearer path from a useful signal to a reviewed customer update, not a promise that outages won’t happen. Explore StatusPulse incident management.
Build a clearer path from endpoint signal to response
Effective endpoint availability monitoring starts with checks that represent real user needs. Define what success means for each endpoint, and treat availability, latency, and functional correctness as separate signals. A failed probe is evidence to investigate, not a complete diagnosis of impact or cause.
Trustworthy monitoring also depends on what happens next. Route alerts to the team responsible, assess which users or services are affected, then share confirmed facts and investigation progress through a public status page. Keep human review in the loop before publishing updates, especially when AI assists with drafting or summaries.
StatusPulse brings uptime and API monitoring, public status pages, and AI-assisted incident management together in one cloud-based platform. Use StatusPulse monitoring and incident communication to connect endpoint signals with a reviewed response process your team can explain and improve over time.
Frequently Asked Questions
What is endpoint availability monitoring?
Endpoint availability monitoring checks whether a defined website route, API resource, or service interface responds according to configured criteria. A check might evaluate its HTTP response code, response time, or selected response content. It provides an external signal about reachability, not proof that every application function works correctly. Define what each check demonstrates, such as whether an API route responds, and document what it cannot detect.
How is endpoint monitoring different from uptime monitoring?
Endpoint monitoring focuses on a particular route or service interface, while uptime monitoring often summarizes availability for a website or broader service. The terms can overlap because an uptime system may use endpoint checks to measure availability. The practical difference is scope. A homepage check can pass while a critical API route fails, so include endpoints that represent meaningful service behavior rather than relying on one broad signal.
Can an endpoint return HTTP 200 and still be unavailable to users?
Yes. An endpoint can return HTTP 200 while serving an error message, stale data, or an incomplete response. A status-code check confirms only that the server returned that code. Where appropriate, add a response-content check that validates meaningful application behavior, or monitor a user-relevant transaction. Keep assertions focused on stable, important content so harmless page changes don’t trigger false alarms.
How often should endpoint availability checks run?
There’s no universally correct interval. Choose a frequency based on the service’s criticality, acceptable detection delay, the impact of missed failures, and the cost of noisy alerts. More frequent checks may reveal changes sooner, but they also produce more observations and can increase alert volume. Review alert history and adjust the interval using evidence from the service, rather than applying an arbitrary default.
Why do endpoint monitoring checks produce false alerts?
A failed observation may result from a temporary network issue, DNS resolution problem, TLS failure, planned maintenance, or a change to the endpoint. The check’s criteria may also fail to match the route’s intended behavior. Review the response details and verify the expected result. Confirmation logic can help assess an isolated failure, but teams should balance fewer false alarms against any added detection delay.
Is endpoint availability monitoring enough to diagnose an outage?
No. Endpoint availability monitoring can show that a route failed its configured check, but it usually can’t identify the root cause or full incident scope. Logs, infrastructure metrics, traces, deployment history, and application-level checks can add diagnostic context. Use the endpoint signal to detect a symptom, then correlate it with the evidence your team needs to investigate and understand what happened.
How can teams communicate an endpoint outage to customers?
Confirm which service is affected and what users can observe before publishing an update. State known impact plainly, separate confirmed facts from active investigation, and avoid promising an unverified resolution time. A public status page gives customers a place to follow progress. Update it as the team learns more, and have a human validate the incident scope and wording before sharing them.


