

A cloud availability monitoring check can report green while users can’t sign in. A successful request to one endpoint says little about a service whose database, identity provider, or regional deployment is failing. Availability depends on a service’s components and their connections, not on a single status signal.
A basic health check can pass while a critical user journey is broken. Infrastructure dashboards may show symptoms without confirming what customers experience. To get a useful view, check the right endpoints, regions, dependencies, and actions, then route alerts to people who can respond.
This guide explains how to build that view: start with user-visible behavior, map the dependencies that can affect it, and test from relevant locations. You’ll also learn how to set actionable alert conditions, communicate incidents clearly, and use availability monitoring alongside infrastructure observability. The goal is to answer a practical question: can users complete the work they came to do?
Key Takeaways
- Define availability by whether users can complete critical actions, not just whether a health endpoint responds.
- Map user-facing services to the dependencies and regions that can affect them, then choose checks that test those failure points.
- Use cloud availability monitoring alongside provider health signals and internal telemetry; each reveals different failures.
- Make alerts actionable by defining failure conditions, routing them to an owner, and grouping related notifications.
- Turn confirmed monitoring signals into clear incident updates, and review checks as services and dependencies change.
What cloud availability monitoring measures, and what a green check misses
Cloud availability monitoring checks whether important services respond as expected from a defined perspective, such as an external location or a running application. To understand whether users can use the service, pair reachability checks with tests of critical application paths, response time, and returned results.
A green check is evidence about one signal at one moment. It doesn’t prove that every dependency works or every user journey succeeds. The cloud management overview describes monitoring and logging as ways to collect performance and availability metrics. Interpreting those signals still requires attention to what users experience.
Availability, uptime, and reliability are related but different
Availability describes whether a service can be accessed and used during a stated period. Uptime percentages summarize whether a system was considered operational, but can hide slow responses, incorrect results, or failures limited to one feature or region.
Reliability is broader: it concerns whether a service behaves dependably over time. Monitoring provides evidence about availability and reliability. It can reveal problems, but it can’t guarantee uninterrupted service.
Why one successful health check can give false confidence
A shallow HTTP check may confirm that a server returned a successful status code. A more useful check might authenticate a test account, request a key resource, and verify the expected response. That path can expose failures in identity, databases, or other dependencies that a basic endpoint check never touches.
An HTTP 200 confirms endpoint reachability, not that a user can complete a transaction. A cached response may also succeed while the underlying service or a downstream dependency is failing. Choose checks that test important behavior, not just a successful response.
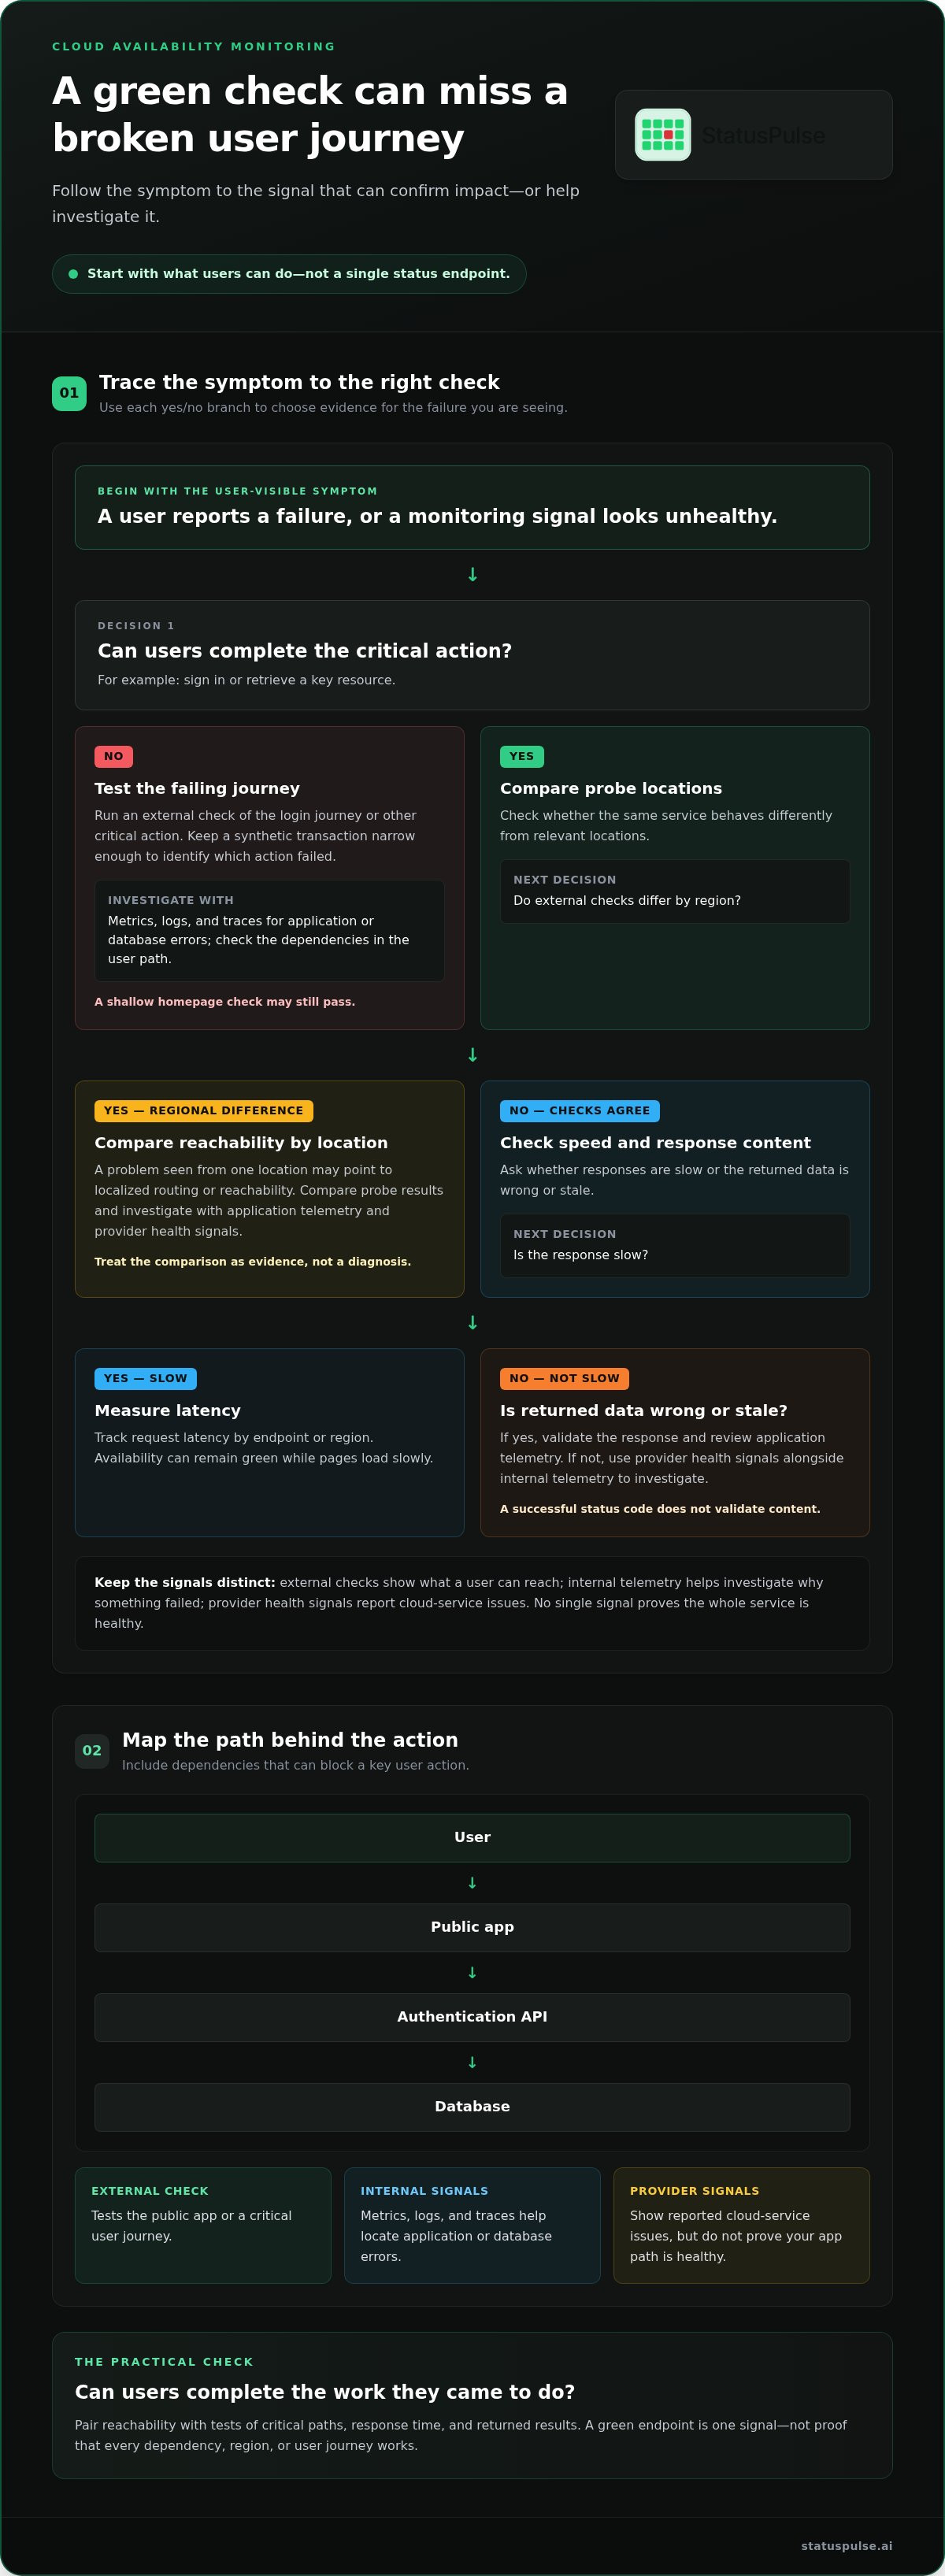
| User-visible symptom | Useful signal | Potential blind spot |
|---|---|---|
| Sign-in fails | External login journey check | A shallow homepage check may pass |
| Pages load slowly | Request latency by endpoint or region | Availability status may remain green |
| Data appears wrong or stale | Response validation and application telemetry | A successful status code doesn’t validate content |
| One region is affected | Checks from multiple locations | A check from another region may pass |
Availability checks answer whether a service responds and whether selected actions work. Latency measures how long responses take; correctness checks whether results match expectations. Infrastructure metrics, logs, and traces help investigate why something failed. Full observability supports deeper questions about system behavior, beyond the predefined checks used in cloud availability monitoring.
How to map cloud services, dependencies, and regions into useful checks
Start with the service a customer uses, not a cloud resource inventory. Trace the dependencies that can prevent that service from working, then assign each dependency a signal that can detect or help diagnose a failure. Application dependency mapping (ADM) can help visualize those relationships.
For a SaaS app, a compact map might look like this:
User → public app → authentication API → database
External check: tests the public app or a critical user journey.
Internal signals: metrics, logs, and traces help locate application or database errors.
Provider health signals: show reported cloud-service issues, but don’t prove your app’s own path is healthy.
Keep the map focused. Include a dependency when its failure can block a key user action, and note which signal can detect that failure. An external check may identify impact without locating the cause, while internal telemetry can help investigate without confirming what a user can reach. For more on designing reliable API checks, see API Monitoring: The Developer’s Guide to High Availability in 2026.
Choose checks that represent real service behavior
Cover the public endpoint and important API routes. Validate essential response conditions, such as the expected status, content, or returned data. DNS resolution, a valid TLS handshake, and an HTTP response each confirm a step in the request path. None confirms that authentication, a query, or another critical function succeeds.
Use synthetic transactions for high-value journeys where they provide useful evidence, such as signing in or retrieving a key resource. Keep each transaction narrow enough to identify which action failed. Avoid checks that create unnecessary load or depend on fragile test data.
Plan regional coverage around actual user and system needs
A probe measures the route and response it sees from its location. Network paths, latency, and DNS resolution can differ, so one location may report a problem that users elsewhere don’t experience, or miss a regional issue entirely. Choose probe locations based on where users connect and where your service needs coverage.
Multi-region checks help compare results. A failure from one location may point to a localized routing or reachability problem, while failures across locations suggest a broader issue. Treat that comparison as evidence, not a diagnosis. Pair external results with application telemetry and provider health signals to investigate further.
For teams refining API checks, API monitoring and availability checks can be part of the same monitoring workflow.
Compare cloud availability monitoring approaches by signal and blind spot
Choose a monitoring method by the question it answers. External synthetic checks show what a probe can reach; provider dashboards add context about cloud services; internal telemetry helps explain application behavior. Cloud availability monitoring works best when these signals complement one another, rather than when one is treated as a replacement for all the others.
| Signal source | Question answered | Useful detection cases | Blind spot | Typical owner |
|---|---|---|---|---|
| External synthetic checks | Can a probe reach the service and complete a selected action? | Public endpoint failures, broken API routes, regional reachability issues | Shows the probe’s perspective; may not reveal the cause or represent every user path | Service or SRE team |
| Provider health dashboards | Is a cloud platform service reporting an issue? | Platform incidents and service-level context | Doesn’t verify that your application or customer workflow works | Cloud operations team |
| Internal telemetry | What is happening inside the application and infrastructure? | Error rates, resource pressure, dependency failures, slow requests | Can miss external reachability problems and requires investigation to interpret | Application, platform, or SRE team |
External checks versus provider-native monitoring
An outside-in check tests reachability from its own probe location. It can catch a failed public endpoint even when internal systems appear normal. Provider-native signals offer a different view, with platform context and diagnostic information about services your application depends on.
Neither view proves every customer workflow is functioning. A provider dashboard can be clear while your configuration or application is failing; an external check can show impact without identifying its cause. For a practical discussion of what uptime signals can and can’t communicate, see Uptime Monitoring: A Developer’s Guide to Reliability and Honest Communication.
Availability monitoring versus full observability
Availability checks detect symptoms against known conditions. Observability signals, such as traces, logs, and infrastructure metrics, help teams investigate why those conditions failed. A failed transaction might prompt you to inspect a trace across services, then use logs to find an error or metrics to check resource saturation.
For complex systems and root-cause analysis, a dedicated observability platform may fit better. Keep the boundary clear: availability monitoring helps answer whether a defined service check passes; deeper telemetry helps explain system behavior beyond those checks. Alert design matters too. Google Cloud’s best practices for alerting can inform how teams route signals to the people responsible for acting on them.
Set cloud availability alerts that lead to action, not alert fatigue
An alert is useful only if it identifies a meaningful problem, reaches someone who can respond, and makes the next step clear. Design cloud availability monitoring alerts around user impact, not every fluctuation in a metric.
Use a short design sequence:
- Define impact: State which user action or operational objective is at risk.
- Choose a check: Select the endpoint, API route, or synthetic journey that provides evidence of that impact.
- Set failure conditions: Decide what combination of failed results or degraded behavior warrants attention.
- Route the alert: Assign a destination and an owner responsible for triage.
- Review: Check whether alerts led to useful action, and adjust when the service or its dependencies change.
Define actionable conditions and ownership
Make conditions specific to the service. A failed sign-in journey may need immediate attention, while a brief increase in latency on a non-critical endpoint could be a warning to review. Don’t apply one failure threshold or availability target to every service. Base the condition on user impact, the service’s operational objectives, and the cost of a missed or noisy alert.
Repeated failures can help distinguish a persistent problem from a transient result. Group related notifications so one incident affecting several checks doesn’t produce a separate page for every symptom. Use a recovery check to confirm the monitored behavior has returned before closing the incident. Keep warnings distinct from incidents that require immediate response, and give each alert a clear owner.
Connect detection to incident communication
Confirmed monitoring evidence can support a timely status update: describe the affected service, the observed impact, and what the team is doing next. Keep automated incident drafts subject to human review before publication. A check can confirm a failure condition, but responders need to verify the scope and choose accurate public wording.
A status page communicates service impact to customers; it doesn’t replace technical investigation or establish root cause. Internal responders still use logs, traces, and infrastructure signals to diagnose the issue. For a deeper look at clear updates during incidents, see The Architecture of Incident Communication Transparency.
Status pages, monitoring, and AI-assisted incident management can support a workflow from detection to reviewed updates. Explore incident monitoring and communication to see how these pieces can fit together.
Build a cloud availability monitoring workflow from checks to clear updates
Roll out cloud availability monitoring around the services and user actions that matter first. A small, well-understood set of checks is easier to validate and maintain than a large inventory with unclear ownership.
Roll out monitoring in manageable stages
Start with an inventory of user-facing services. For each one, record critical endpoints, dependencies that can block important actions, and the operational owner. Then add representative checks for those paths, including expected responses and the conditions that count as failure.
Validate each check by testing both success and failure behavior. Document what it can detect and where it has blind spots. After an incident or service change, review whether the check caught the impact, whether alerts reached the right owner, and whether important paths remain uncovered. Remove or revise checks that no longer inform a decision.
Know where monitoring ends
An availability check reports whether a defined condition passed from its observation point. It can identify a failing endpoint or journey, but usually can’t establish the underlying cause. Provider diagnostics help assess cloud platform conditions; application observability tools use metrics, logs, and traces to investigate failures across components. Keep these roles distinct: detection signals start the response, while diagnostic evidence guides the investigation.
Where StatusPulse fits in the workflow
Once checks, owners, and communication steps are clear, a monitoring and status workflow can connect detection to customer updates. StatusPulse provides uptime, API, and SSL certificate monitoring alongside public status pages. Its AI-assisted incident management can help draft incident updates, while people review and decide what to publish.
Use the workflow you’ve defined as a basis for evaluating monitoring and incident communication in one platform. These tools support detection and customer updates; provider diagnostics and observability remain useful for deeper root-cause analysis.
Make availability signals useful from detection to response
Cloud availability monitoring is strongest when checks reflect real user actions, cover the dependencies and regions that matter, and route failures to an owner who can act. A green check is one piece of evidence, not a guarantee that every customer journey works. Pair external checks with provider signals and internal telemetry, then review coverage and alert quality as services change.
Detection is only part of the response. Clear public updates help customers understand service impact, while technical teams use diagnostics to investigate and resolve the cause. StatusPulse brings uptime, API, and SSL certificate monitoring together with public status pages and AI-assisted incident management. People retain control of incident updates.
Build from the checks your users and responders need. Explore StatusPulse’s monitoring and status page platform to see how monitoring and incident communication can work together. A thoughtful set of checks can give your team a clearer signal and a steadier path from detection to response.
Frequently Asked Questions
What is cloud availability monitoring?
Cloud availability monitoring uses checks to test whether a cloud-hosted service can be reached and performs selected actions as expected. Checks might request a public endpoint, call an API route, or test a critical user journey. Results show what worked from a particular location and at a particular time. They provide evidence of service availability, not a guarantee that every feature or customer path is healthy.
How do you monitor availability across multiple cloud regions?
Run external checks from locations relevant to your users and compare results across regions. If a check fails from one location but succeeds elsewhere, that difference may help narrow the investigation toward a localized reachability or routing issue. If failures appear across locations, check internal telemetry and provider health signals for broader context. Probe results describe their own network paths, so they don’t represent every user’s experience.
What is the difference between cloud monitoring and availability monitoring?
Cloud monitoring is a broad practice that can track infrastructure metrics, logs, traces, platform health, and application behavior. Availability monitoring focuses on whether defined services or user-facing actions respond as expected. The two overlap, but answer different questions. An availability check can flag a failed API request; infrastructure metrics and application logs may help explain whether resource pressure, an error, or another dependency caused it.
Can availability monitoring detect API failures?
Yes. An API check can request a route and validate conditions such as the response status, expected content, or response time. A basic reachability check may catch an unavailable endpoint, while validation can also identify responses that arrive successfully but contain an error or unexpected result. Choose routes and response conditions that represent important service behavior. Use application telemetry to investigate the cause of a detected failure.
How often should cloud availability checks run?
There’s no universal interval. Set check frequency based on how quickly the team needs to detect an issue, the service’s operational objectives, and the consequences of missed or noisy signals. More frequent checks can provide faster evidence, but may also create more notifications or traffic. Set different cadences for critical user journeys and lower-priority endpoints, then review whether the checks detect meaningful failures in time to act.
Does availability monitoring replace observability?
No. Availability monitoring tests predefined conditions and helps detect user-visible symptoms. Observability uses signals such as traces, logs, and metrics to investigate system behavior and likely causes. A failed synthetic transaction can identify an affected journey, while a trace may show where a request stalled across services. Teams with complex systems may need dedicated observability tools for deeper root-cause analysis alongside availability checks.
How can monitoring alerts support customer status updates?
Alerts can give responders timely evidence that a monitored service or user journey is failing. Use the signal to begin triage, then confirm the affected scope before publishing a status update. A public status page can communicate known impact and investigation progress, but it doesn’t replace technical diagnosis. AI-assisted incident management can help draft updates; a person should review the details and approve publication.


