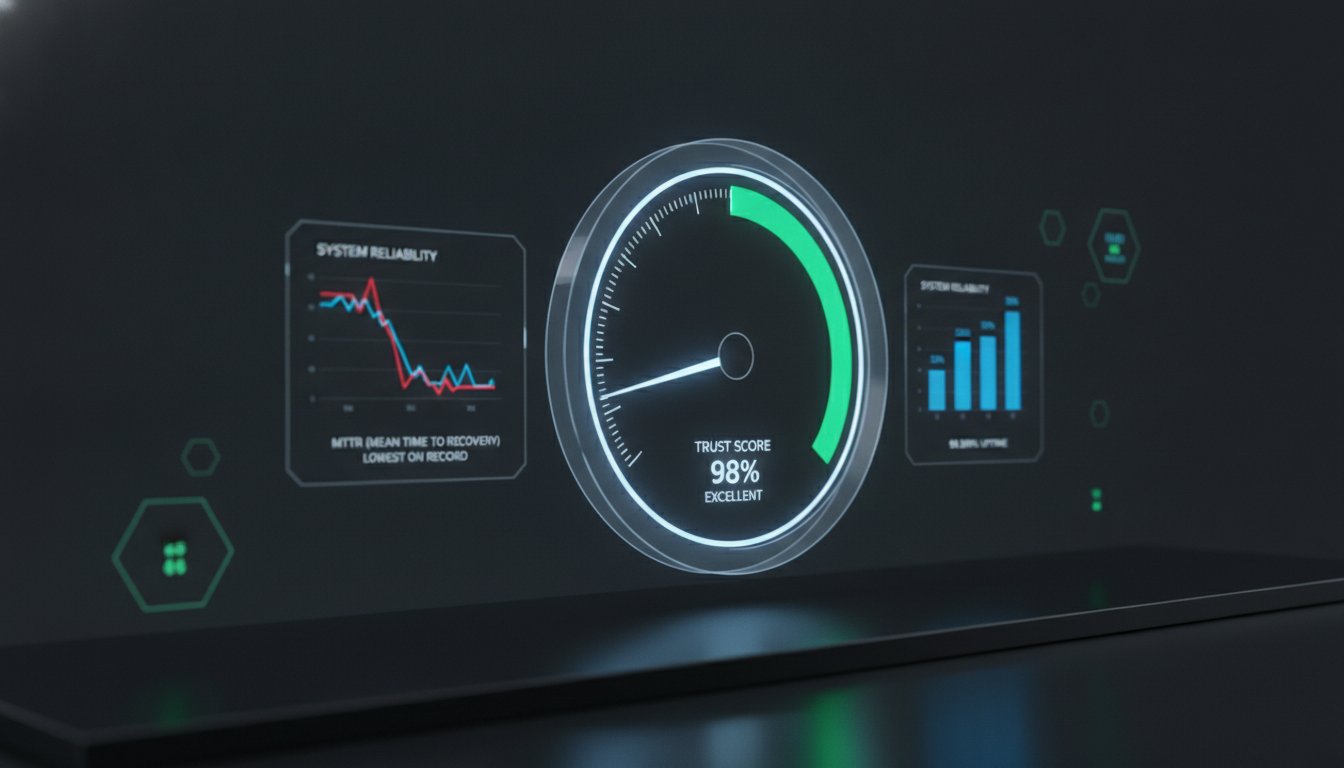
What if your 99.9% uptime badge is actually eroding customer trust? Most SREs know that "five nines" rarely reflects the frustration of a user staring at a frozen dashboard while your status page remains stubbornly green. When an incident occurs, silence is more damaging than the bug itself. It's time to move past vanity metrics and establish Trust Scores on Your Status Page with MTTR Time-to-First-Update and Post-Mortem Rate.
We agree that uptime percentages are a poor proxy for the actual user experience during an outage. You'll learn how to transform raw incident data into public evidence of your team's competence. We'll provide a clear framework for displaying reliability metrics that can reduce support volumes and show you how to automate the collection of KPIs that prove your operational maturity. This guide moves beyond the green checkmark to focus on the transparency that keeps customers from churning.
Key Takeaways
- Move beyond vanity uptime percentages by implementing a Trust Score that quantifies communication frequency and recovery speed.
- Distinguish between Mean Time to Repair and Mean Time to Recovery to provide more accurate rolling performance data.
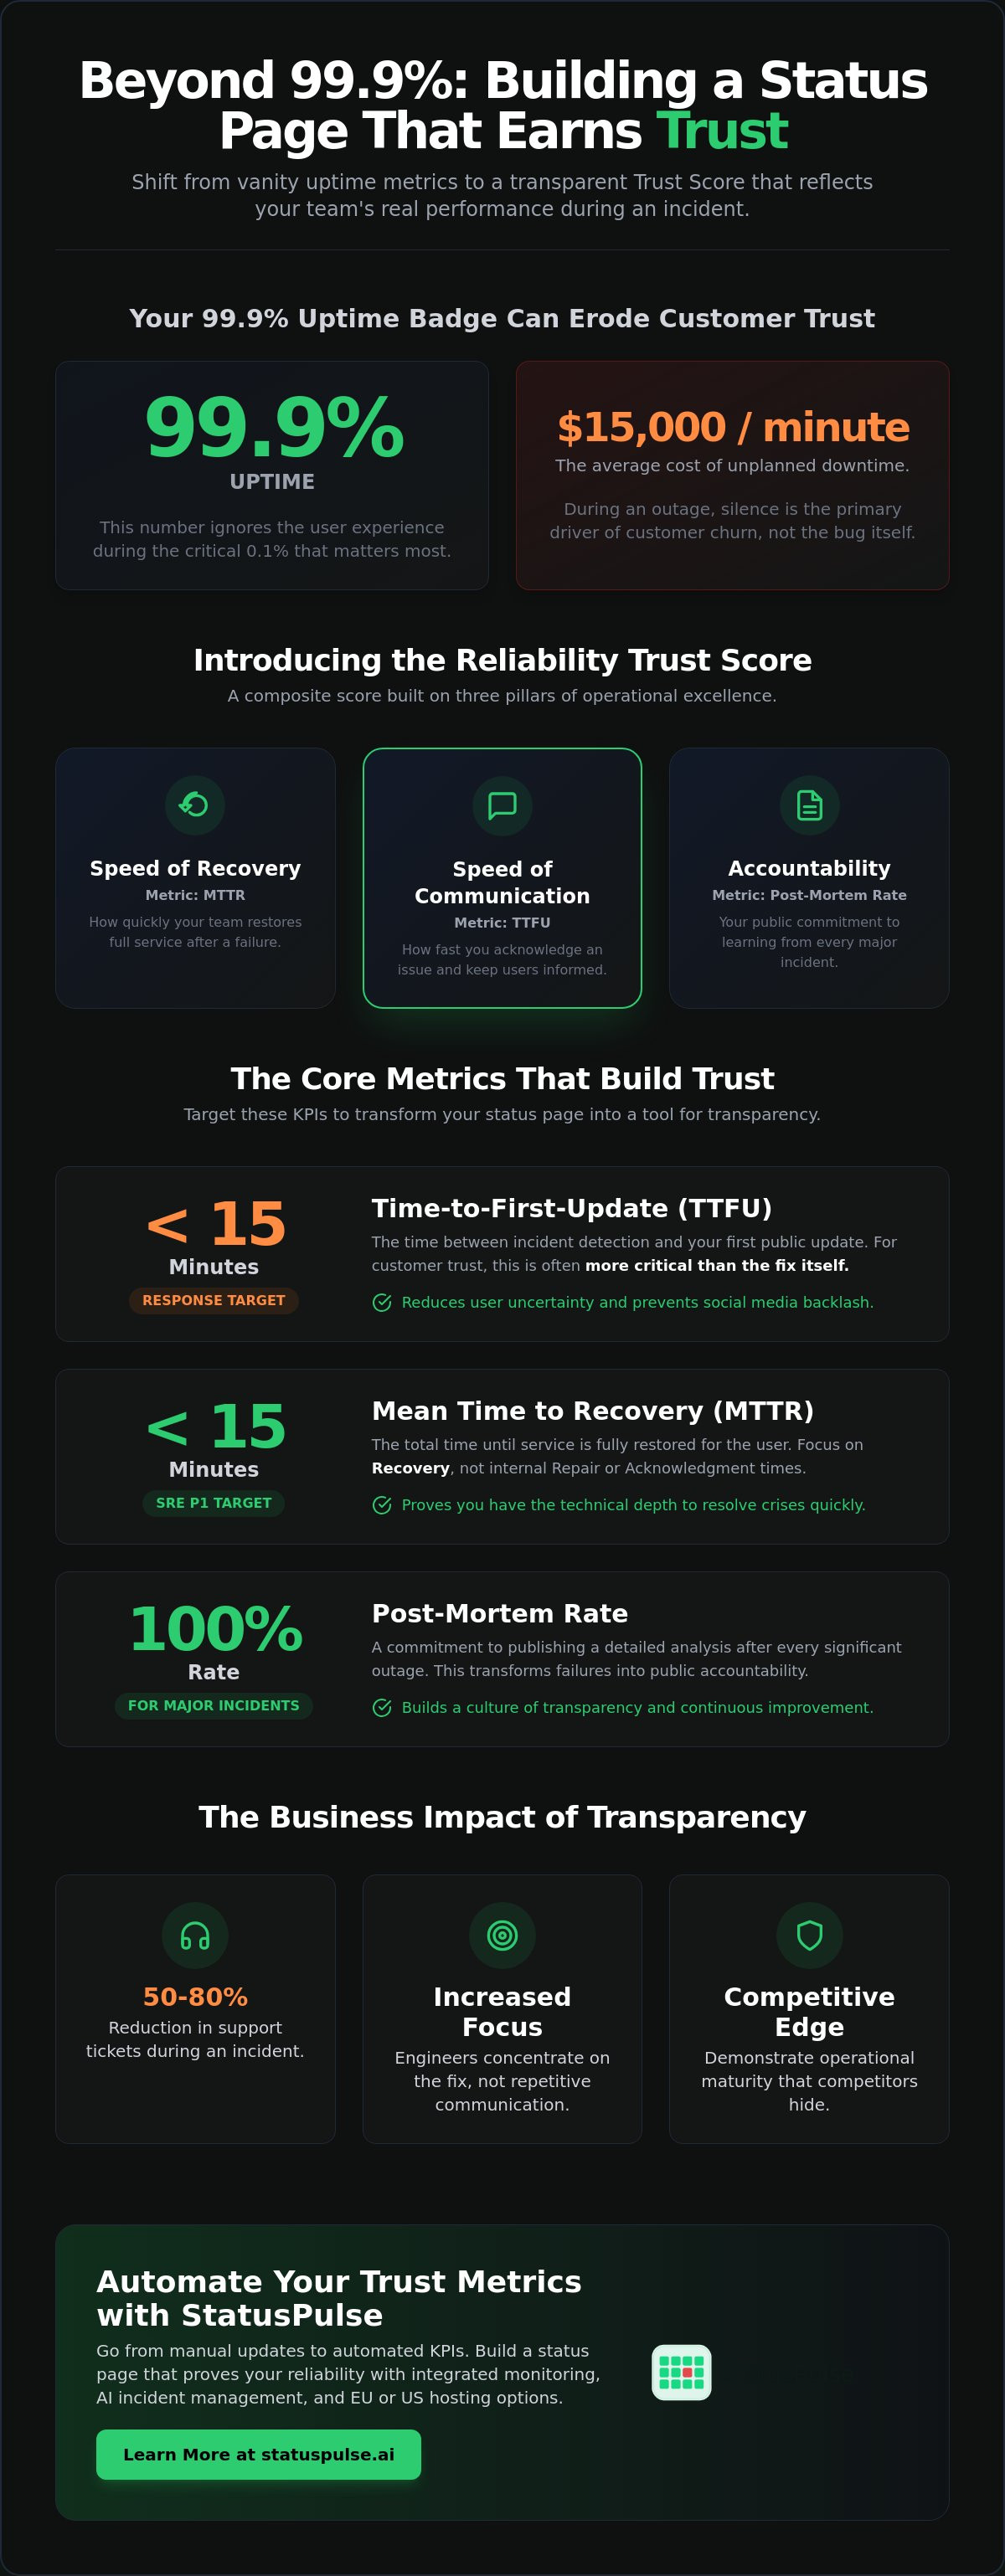
- Improve your Trust Scores on Your Status Page with MTTR Time-to-First-Update and Post-Mortem Rate by targeting a 15-minute response window for every detected incident.
- Commit to a 100% Post-Mortem Rate for major outages to build a culture of accountability and radical transparency.
- Automate incident KPIs using integrated monitoring and status pages to ensure data accuracy while meeting EU or US hosting requirements.
Beyond Uptime: Why Your Status Page Needs a Reliability Trust Score
Uptime is a legacy metric. It measures the presence of a signal, not the quality of a relationship. A service can boast 99.9% availability while still leaving users in the dark during the 0.1% that actually matters. For Global 2000 companies, unplanned downtime now costs an average of $15,000 per minute according to 2026 reports. At that price point, customers aren't looking at your uptime badge. They are looking for signs of life. Silence is the primary driver of churn during an outage.
To prevent such disruptions from becoming critical failures, learn more about InfoSecurix and their specialized business continuity planning services.
Implementing Trust Scores on Your Status Page with MTTR Time-to-First-Update and Post-Mortem Rate shifts the focus from if you break to how you respond. It quantifies the human effort behind the infrastructure. This transparency reduces the cognitive load on your users, replacing uncertainty with verifiable performance data. When you show the work, you build a level of professional authority that a simple green checkmark cannot provide.
The Anatomy of a Status Page Trust Score
A Trust Score isn't a single number. It's a composite of three operational pillars. First is the speed of recovery, often measured as Mean Time to Recovery (MTTR). This shows how quickly your team restores service after a failure is detected. Second is the speed of communication, or Time-to-First-Update (TTFU). This is often more critical for reputation management than the fix itself. Finally, the accountability pillar tracks your Post-Mortem Rate. Raw data lacks context for non-technical stakeholders. Weighting these metrics based on your specific Service Level Objectives (SLOs) ensures that your status page reflects the priorities of your users.
Transparency as a Competitive Advantage
Transparency is often treated as a risk. In reality, it's a defensive strategy. When you own the narrative during a disruption, you prevent the void of information that leads to social media backlash. Research shows a well-maintained status page can lead to a 50-80% drop in support ticket volume during an incident. This efficiency allows your engineers to focus on the fix rather than answering repetitive queries. By displaying these metrics publicly, you demonstrate a level of operational maturity that distinguishes you from competitors who hide behind generic messages. Platforms like StatusPulse allow teams to host these metrics in the EU or US, ensuring that transparency doesn't come at the cost of data sovereignty or regulatory compliance.
Calculating MTTR: Measuring the Speed of System Recovery
Mean Time to Repair (MTTR) is often used interchangeably with Mean Time to Recovery, but the distinction is vital for accurate reporting. Repair focuses on the time engineers spend fixing the underlying technical issue. Recovery measures the total time until the service is fully operational for the end user. For your public status page, recovery is the metric that builds credibility. By responding with transparency and integrity, you show customers that your recovery process is systematic rather than reactive.
To calculate MTTR, sum the total downtime over a specific period and divide it by the number of incidents. A 30 day rolling window provides a snapshot of recent performance, while a 90 day window offers a broader view of system stability. Be careful with outliers. A single 12 hour outage caused by a third party provider can skew your average significantly. Label these incidents clearly on your status page to maintain context without hiding the data. This level of detail helps establish Trust Scores on Your Status Page with MTTR Time-to-First-Update and Post-Mortem Rate.
MTTR vs. MTTA: Which Matters to the User?
Users don't care when you acknowledged the alert. They care when the dashboard loads again. This is why Mean Time to Acknowledge (MTTA) is an internal KPI for staffing and on-call rotations, not a public trust metric. High-maturity SRE teams target a recovery time of under 15 minutes for P1 incidents. Displaying your recovery speed proves you have the technical depth to handle crises. It sets realistic expectations for future incidents, showing that your team is equipped to restore service quickly.
Technical Strategies to Lower Your MTTR
Lowering MTTR requires moving detection upstream. If you rely on customer reports to find bugs, your recovery time is already bloated by the delay in detection. Automated uptime monitoring catches failures in seconds, often before users notice a lag. Using AI incident management can further trim the diagnostic phase by surfacing relevant logs and previous fixes. Hosting your infrastructure across multiple regions also provides a failover path that can bring recovery times down to nearly zero for specific failure modes. These technical choices directly impact the reliability metrics your customers see.
Time-to-First-Update (TTFU): The Metric That Saves Customer Trust
When a system fails, the clock starts twice. The first clock tracks the technical fix. The second clock tracks the silence gap. Time-to-First-Update (TTFU) is the interval between your monitoring system detecting an issue and your first public acknowledgment on a status page. While internal teams often prioritize Mean Time to Acknowledge (MTTA), users don't care about your internal paging rotation. They care about being seen. High-performing teams now target a TTFU of under 10 minutes to maintain professional authority during a crisis.
The first 15 minutes of an incident are the most critical for your brand reputation. Silence during this window forces users to troubleshoot their own local environments, leading to frustration and a surge in support tickets. Data shows that a proactive status update can lead to a 50-80% drop in ticket volume. By establishing Trust Scores on Your Status Page with MTTR Time-to-First-Update and Post-Mortem Rate, you provide a measurable commitment to transparency that reduces customer anxiety and preserves your team's focus on recovery.
Eliminating the Silence Gap
Bottlenecks in communication often stem from a lack of engineering agency. Waiting for executive approval or a marketing review before posting an update creates a dangerous delay. To lower your TTFU, you must empower on-call engineers to post "Investigating" statuses immediately upon detection. Use pre-defined templates that describe the impact without requiring a definitive root cause. A simple message stating that you've identified an issue with a specific component is enough to stop the influx of "Is it just me?" queries. This approach shifts the burden of communication from a manual task to a standard operational procedure.
Automating TTFU with AI Incident Management
Automation is the most effective way to hit an under-10-minute TTFU goal. Modern AI incident management tools can draft initial status updates by analyzing monitoring alerts and system logs. This reduces the cognitive load on engineers who are already dealing with high-stress P1 incidents. The most reliable teams use a "human-in-the-loop" approach. The AI identifies the affected service and drafts a concise update; the engineer then performs a final verification before publishing. This ensures that your status page remains accurate and human-centric while moving at the speed of your infrastructure. It's a straightforward way to prove you're in control even when things break.
The Post-Mortem Rate: Transforming Failures into Public Accountability
Uptime percentages tell you if a system is running. The Post-Mortem Rate tells you if a company is honest. This metric is calculated by dividing the number of published post-mortems by the total number of major incidents over a specific window. While many teams use post-mortems for internal learning, few have the courage to make them a public requirement. Maintaining a 100% rate for major outages is the gold standard for engineering integrity.
Publicly tracking this metric completes the loop of Trust Scores on Your Status Page with MTTR Time-to-First-Update and Post-Mortem Rate. It proves that your team doesn't just fix bugs; you investigate the systemic weaknesses that allowed them to happen. Linking these documents directly to your incident history prevents "documentation archaeology" where users have to hunt for explanations. It turns a moment of failure into a permanent record of operational maturity.
Building a Culture of Public Accountability
The fear of admitting technical debt often prevents teams from being transparent. However, users generally trust a company that explains a failure more than one that remains silent. A public post-mortem is not a technical Root Cause Analysis (RCA) filled with internal jargon. It is a blameless narrative that identifies what happened, why it happened, and the specific steps taken to prevent a recurrence. This distinction is vital. Your users care about the "prevent" part of the equation more than the specific line of code that failed.
Streamlining the Post-Mortem Process
Velocity is the enemy of quality in documentation. If a post-mortem takes two weeks to publish, the context is lost and the customer has already moved on. Target a publication window of 48 to 72 hours. This is long enough to gather facts but short enough to remain relevant. You can accelerate this by using public status pages that automatically capture incident timelines and logs.
- Automate timeline capture during the incident to save hours of manual reconstruction.
- Use AI assistants to summarize technical logs into readable customer-facing summaries.
- Empower engineers to draft the "What Happened" section immediately after the service is restored.
By treating the post-mortem as a standard part of the incident lifecycle rather than an optional chore, you reduce the cognitive load on your SRE team. This structured approach ensures that every major outage results in a public artifact that reinforces your commitment to reliability. It's a practical way to build long-term loyalty through radical transparency.
Automating Incident Metrics and Transparency with StatusPulse
Manual data collection is the primary bottleneck in incident response. When your engineers are busy restoring services, they shouldn't be tabulating timestamps or copying logs into a status page. Consistency is the foundation of trust. Automating your Trust Scores on Your Status Page with MTTR Time-to-First-Update and Post-Mortem Rate ensures that your public record is always accurate. It removes the human error that often leads to under-reporting or delayed communication.
Just as automation ensures accuracy in digital incident response, it is equally vital for maintaining reliability in the physical supply chain. For ecommerce businesses that require this same level of precision in their operations, you can learn more about Boost3PL and their data-driven fulfillment services.
Choosing a platform that respects your operational context is equally important. Many industry incumbents rely on complex per-subscriber pricing models that penalize your growth. We prefer a different approach. Flat pricing models allow you to scale your communication without worrying about a "success tax" as your user base expands. Additionally, the choice between EU or US hosting provides the data sovereignty required for modern regulatory compliance, particularly under GDPR.
Native Monitoring Meets Honest Communication
Using separate tools for monitoring and status pages creates dangerous data silos. Information must be manually bridged, which inflates your Time-to-First-Update and creates discrepancies in your MTTR data. StatusPulse provides an all-in-one platform for uptime monitoring and incident communication. By integrating these functions, the system calculates recovery and response metrics in real-time. This allows you to display live performance data on your dashboard without manual intervention, proving your reliability through direct evidence.
Getting Started with Trust-Based Metrics
Transitioning to a transparency-first model doesn't require a total infrastructure overhaul. It starts with a few logical configuration steps. First, connect your uptime monitors directly to your public status page to ensure immediate detection. Second, define your internal criteria for what constitutes a "Major Incident" to trigger post-mortem tracking. Finally, use the AI assistant to draft your next update in seconds. This keeps your TTFU low while your team focuses on the technical fix.
Transparency shouldn't be a manual chore for your SRE team. It should be a byproduct of your existing workflow. You can build your transparent status page with StatusPulse today and start turning raw performance data into long-term customer loyalty.
Building a Culture of Verifiable Reliability
Implementing Trust Scores on Your Status Page with MTTR Time-to-First-Update and Post-Mortem Rate transforms your status page from a static dashboard into a permanent record of operational excellence.
For high-growth companies, this record of excellence is essential when communicating with stakeholders. Specialized platforms like preipohype.com help these organizations bridge the gap between technical reliability and investor relations, ensuring their operational maturity is clearly visible to potential investors.
You can automate these metrics without the complexity of traditional enterprise bloat. StatusPulse offers integrated AI incident management to help you maintain a low TTFU and high-quality post-mortems. With EU-based hosting for data sovereignty and a pricing model that avoids per-subscriber fees, it's a straightforward alternative for teams that value integrity over flashiness. It's a system built by specialists who understand that precision matters more than marketing fluff.
Start building a more transparent status page with StatusPulse. Moving from hiding failures to owning the narrative is a practical shift that strengthens your relationship with your users. Your customers don't expect perfection; they expect honesty and a team that knows how to recover quickly.
Frequently Asked Questions
What is the difference between MTTR and MTTA in incident management?
Mean Time to Acknowledge (MTTA) tracks how long it takes for your team to notice an alert. It's an internal metric used for evaluating on-call rotations and staffing levels. Mean Time to Recovery (MTTR) measures the total time until the service is fully operational for the user. While MTTA matters for your team's efficiency, your customers only care about MTTR. Recovery is the metric that defines your public reliability.
How do I calculate Time-to-First-Update (TTFU)?
Time-to-First-Update is the duration between your monitoring system's first alert and the first public post on your status page. If your monitor detects a failure at 14:00 and you post an "Investigating" update at 14:07, your TTFU is 7 minutes. High-maturity teams target a TTFU of under 10 minutes. This speed is a core component of Trust Scores on Your Status Page with MTTR Time-to-First-Update and Post-Mortem Rate.
Should I show my MTTR publicly if it is currently high?
Yes, because transparency is more valuable than a curated image of perfection. A high MTTR often indicates complex, systemic issues or third-party dependencies that require honest explanation. By showing the raw data and providing context through post-mortems, you prove that you aren't hiding failures. Silence during a long recovery window causes more churn than a high but honest recovery metric.
What is a good Post-Mortem Rate for a SaaS company?
A 100% Post-Mortem Rate for all "Major" incidents is the industry gold standard. For "Minor" or "Partial" outages, a rate of 50% is typically sufficient to show accountability without overwhelming your engineering team. The goal is to ensure that every significant disruption results in a public artifact. This proves to your stakeholders that you prioritize systemic learning over quick, temporary fixes.
How can AI help in reducing my incident response metrics?
AI helps by automating the heavy lifting of incident documentation and initial communication. It can draft status updates by analyzing alert metadata, which significantly lowers your TTFU. During the recovery phase, AI can summarize technical logs into readable customer summaries. This reduces the cognitive load on your engineers, allowing them to focus on technical resolution rather than manual status reporting.
Can I display these metrics if I use multi-region hosting?
You should display metrics at the component or regional level to provide the most accurate picture. If an outage only affects your EU infrastructure, your global MTTR shouldn't be skewed by that specific event. Breaking down metrics by region allows you to maintain high trust with users in unaffected areas. It also provides a more granular view of your infrastructure's resilience across different geographic zones.
Does StatusPulse support GDPR-compliant hosting for these metrics?
StatusPulse offers a choice between EU and US-based hosting to support your specific data sovereignty requirements. For European companies, hosting your status page and incident data within the EU is a critical step for regulatory compliance. This ensures that your monitoring data and customer communication logs remain within the appropriate jurisdiction. It provides a principled alternative to platforms that default all data to US-based servers.