

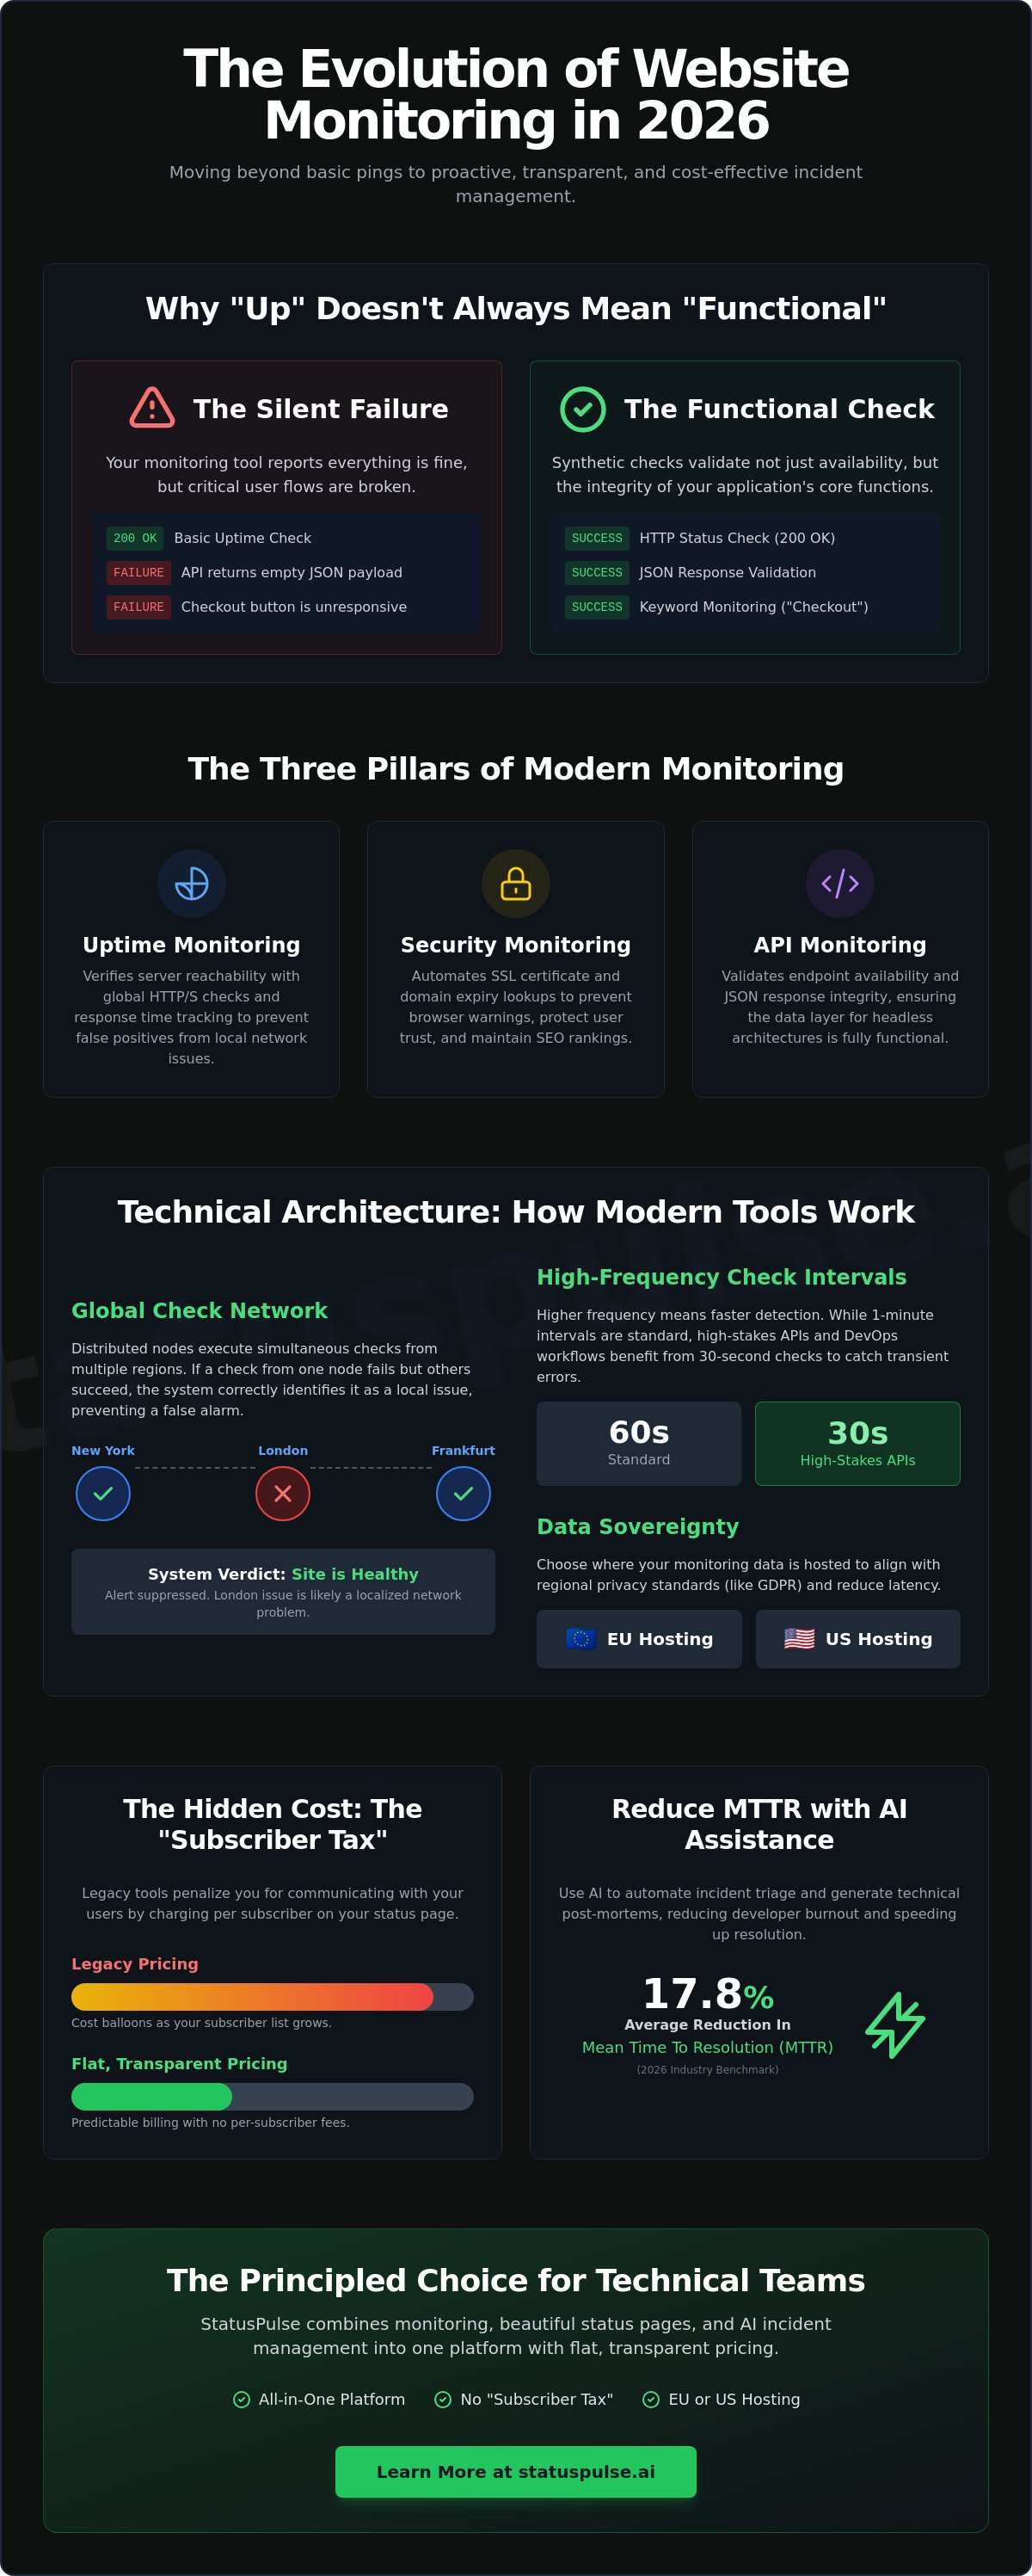
A silent API failure occurs at 3:00 AM. Your basic uptime check returns a 200 OK status, but the JSON payload is empty. By the time you realize your checkout flow is broken, your support inbox is already full. This gap between "up" and "functional" is where traditional website monitoring software often fails.
You likely agree that maintaining high availability shouldn't feel like a constant battle against silent outages or ballooning costs. Monitoring is only half the battle. The true value lies in how you automate honest communication during the inevitable downtime. You're tired of complex pricing models and tools that charge a "subscriber tax" just to keep your customers informed.
This guide teaches you how to evaluate monitoring tools based on technical precision, incident transparency, and the total cost of ownership in 2026. We will show you how to achieve 99.9% visibility into global latency while maintaining strict data sovereignty. We'll move from simple pings to a logic-driven approach that ensures predictable monthly billing and automated incident updates.
Key Takeaways
- Distinguish between local network blips and global outages using multi-region check nodes.
- Expose the "subscriber tax" and hidden costs found in legacy website monitoring software.
- Evaluate the operational trade-offs of 30-second check intervals for high-stakes API monitoring.
- Reduce developer burnout by using AI to assist with incident triage and technical post-mortems.
- Maintain data sovereignty by choosing between dedicated EU or US hosting for your monitoring stack.
What is Website Monitoring Software in 2026?
By definition, What is Website Monitoring Software? It's no longer just a "ping" from a single server to see if your homepage loads. In 2026, it's a suite of synthetic checks that verify availability, performance, and security from global nodes. While marketing teams use these tools to protect revenue, technical teams use website monitoring software to verify system integrity before a customer ever reports a bug.
Modern software has shifted toward observability-driven incident response. A simple green light doesn't tell you if your database is locked or if your API is returning empty arrays. Teams using AI-powered incident management report an average reduction in Mean Time To Resolution (MTTR) of 17.8%, based on 2026 industry benchmarks. Public status pages are now a non-negotiable component of this stack. They automate the ethical communication of downtime, shifting the burden from support teams to automated systems.
The Three Pillars of Modern Monitoring
To be effective, your monitoring strategy must address three distinct areas of technical health:
- Uptime Monitoring: This involves tracking HTTP/HTTPS status codes and global response times. It identifies if your server is reachable from different geographic regions, preventing "false positives" caused by local network blips.
- Security Monitoring: Tools now automate SSL certificate expiry lookups. This prevents embarrassing browser warnings that kill user trust and destroy SEO rankings.
- API Monitoring: For headless architectures, this validates JSON responses and endpoint availability. It's about ensuring the data layer is as healthy as the front end.
Why "Up" Does Not Always Mean "Functional"
Silent failures are the most dangerous threats to your SLA. Your server might return a 200 OK status, but the page content could be missing or the "Add to Cart" button might be unresponsive. Keyword monitoring solves this by searching for specific strings on the page. If "Welcome" or "Checkout" isn't found, the monitor triggers an alert immediately.
Synthetic monitoring is the simulation of user behavior to verify complex workflows. By mimicking a real user, you can catch database connection errors that basic uptime checks miss. Platforms like StatusPulse address these technical challenges by combining monitoring with AI incident management. This helps small, dedicated teams move from "War Room" panic to structured, logical resolution without the bloat of traditional enterprise tools.
Technical Architecture: How Modern Monitoring Tools Work
Understanding How Modern Monitoring Tools Work requires looking past the dashboard. Reliable website monitoring software relies on a distributed network of global check nodes. These nodes execute requests from multiple geographic locations simultaneously. This prevents "false positives" caused by localized network congestion or a single ISP failure. If a node in London fails but nodes in Frankfurt and New York succeed, the system knows your site is healthy and suppresses the alert.
Check intervals define your visibility into system performance. A 1-minute interval is standard for most production sites. However, high-traffic DevOps workflows often require 30-second intervals to catch transient errors or "flapping" services. Integrating these checks into CI/CD pipelines ensures that a new deployment doesn't break site health before traffic scales. This creates a safety net that catches regressions in real-time.
Data sovereignty is a primary concern for technical teams. Hosting monitoring data in the same region as your users reduces latency and ensures compliance with regional privacy standards. Choosing between EU and US-based hosting allows you to align with your specific regulatory needs without defaulting to a single provider's preference. This geographic flexibility is a core requirement for modern infrastructure.
Synthetic vs. Real User Monitoring (RUM)
Synthetic checks are superior for immediate incident detection. They don't rely on actual user traffic, meaning they can alert you at 2:00 AM when your site is empty. Agentless monitoring software is often preferred for its lower overhead compared to agent-based systems that require code injection. For a basic comparison, a simple health check script might look like this:
# Simple health check script
curl -Is https://example.com | head -n 1 | grep "200 OK" || echo "Site Down"
SSL and Domain Health Automation
Manual certificate tracking is a high-risk technical debt. It's too easy for a spreadsheet to go out of date. Automated domain expiration lookup mechanisms remove this human error. In 2026, SSL validity is directly linked to SEO rankings. A single day of an expired cert can cause a significant drop in search visibility. By automating these lookups, you protect your technical reputation and your traffic.
If you want to simplify your stack, StatusPulse offers integrated monitoring and status pages in one place. It's a straightforward way to keep your team informed without the complexity of enterprise bloat.
Evaluating Total Cost: The "Subscriber Tax" and Hidden Fees
Many vendors lure technical teams with low entry prices. They often hide the real cost of ownership in what we call a "subscriber tax." If you have 5,000 customers following your status page, a single outage could trigger 5,000 paid notifications. This model turns a technical crisis into a financial one. You shouldn't be penalized for growing your user base or for being transparent during downtime.
Transparent, flat-rate pricing is vital for growing SaaS companies. It allows for predictable monthly billing regardless of how many people subscribe to your updates. While enterprise tools like New Relic or Datadog are excellent for deep application performance monitoring (APM), they're often overkill for uptime. For many teams, the priority is a Case Study: Reducing MTTR through better visibility, not managing a massive observability bill for features they don't use.
Free tiers of website monitoring software also come with technical trade-offs. Most limit check intervals to five minutes or restrict monitoring to a single geographic region. This creates blind spots. If your site goes down in London but your only monitor is in Virginia, you won't know until a customer complains. Effective monitoring requires a balance of frequent checks and global reach without hidden scaling fees.
The Problem with Per-Subscriber Pricing
Ethical pricing models focus on the work being done, not the size of your audience. You should pay for the number of monitors and the frequency of checks. Charging per notification is an outdated industry practice that discourages honesty. Before signing a multi-year contract, ask these questions:
- Are there hard limits on the number of status page subscribers?
- Does the check interval increase if I move to a lower tier?
- Are global check nodes restricted based on my monthly spend?
- Is there an extra fee for AI-driven incident management?
Data Residency and Compliance
Hosting your status page in the same region as your users is a technical necessity. It ensures that your communication remains available even if a specific regional backbone fails. For European entities, GDPR compliance and the latest EU Data Act requirements make data residency a core concern. US-only hosting is often a deal-breaker for fintech or government clients who must maintain strict data sovereignty. Choosing a provider that offers a choice between EU and US hosting allows you to meet these regulatory standards without sacrificing performance.
Case Study: Reducing MTTR with AI Incident Management
DevOps burnout often peaks during "War Room" scenarios. When a critical outage occurs, your primary focus is finding the root cause and deploying a fix. Drafting a technical post-mortem or updating customers is usually the last thing on your mind. Modern website monitoring software is now evolving to solve this manual labor gap through AI integration.
AI incident management doesn't replace the engineer. It acts as an assistant that summarizes complex logs into human-readable updates. For example, instead of manually parsing a stack trace for public consumption, the system identifies a database timeout and drafts a status update: "Investigating connectivity issues with our primary database cluster." This allows you to focus on the fix while the communication layer remains active. Teams using AI-powered incident management platforms report an average reduction in Mean Time To Resolution (MTTR) of 17.8%.
Workflow: From Down to Notified in 60 Seconds
A reliable notification path follows a logical, automated sequence that respects your time. It moves from detection to communication without requiring manual intervention during the initial panic:
- Step 1: A check failure is detected across at least three global regions to confirm the outage is real.
- Step 2: An automated alert is dispatched immediately to Slack or PagerDuty to wake the on-call engineer.
- Step 3: The system creates an AI-generated draft for the public status page, ready for a quick human review.
Building Trust Through Transparency
Honest incident updates prevent customer churn. Users are generally forgiving of downtime if they know you're actively working on it. One SaaS team reported reducing their support ticket volume by 40% after implementing automated public status pages. This transparency proves SLA compliance through historical uptime charts, showing your long-term reliability rather than just a single point of failure. It shifts the narrative from a broken service to a principled, responsive team.
If you're tired of drafting manual updates during a crisis, explore how StatusPulse automates your incident communication.
StatusPulse: The Principled Choice for Technical Teams
Managing a "Frankenstein" stack of three different tools for monitoring, communication, and triage is a drain on your focus. When an incident occurs, you shouldn't be jumping between tabs to update a status page while simultaneously parsing logs. StatusPulse consolidates uptime monitoring, public status pages, and AI incident management into a single dashboard. It's a principled approach to website monitoring software that prioritizes technical depth over corporate bloat.
Data sovereignty is a core requirement for modern infrastructure. Many incumbents default to US-only hosting, which creates legal and latency hurdles for European entities. We offer a choice between dedicated EU and US hosting. This ensures your monitoring stack aligns with local data privacy standards and provides the lowest possible latency for your check nodes. It's about giving you control over where your data lives without defaulting to a single region's preference.
Integrated Monitoring and Communication
Having website uptime monitoring tools and status pages in one place reduces context switching during high-pressure outages. Setup is straightforward for developers. You can configure monitors and link them to your status page in minutes. We provide a 1-minute check interval as a standard feature, not a premium luxury. This ensures you catch performance regressions before they impact your users, all while maintaining a single source of truth for your team.
The integrated dashboard simplifies the workflow. You don't need to manage separate API keys or worry about data syncing between disparate platforms. By using a single, cohesive tool, you reduce the surface area for configuration errors. This leads to more reliable monitoring and faster incident response times for your entire DevOps team.
Final Recommendation
StatusPulse is built for small to mid-sized technical teams who value specialists over faceless conglomerates. If you're tired of complex pricing and per-subscriber fees, it's time to switch to a more ethical model. We believe in providing a tool that solves problems effectively without the need for hyperbolic marketing or corporate bloat. Prioritize technical substance and honest communication over traditional enterprise hype.
Build a transparent status page with StatusPulse today and take control of your incident communication with a tool built by specialists, for specialists.
Prioritizing Integrity in Your Monitoring Stack
Modern reliability requires more than a simple uptime check. It demands a strategy that combines technical precision with honest, automated communication. You've seen how global check nodes prevent false positives and why 1-minute intervals are the standard for production environments. Choosing website monitoring software shouldn't force a trade-off between technical depth and fair pricing. The industry's reliance on hidden subscriber fees is a barrier to transparency that your team can now avoid.
By integrating AI-powered incident drafting and regional hosting options in the EU and US, you can maintain data sovereignty while reducing MTTR. This approach respects your time and your customers' trust. It's about moving away from fragmented tools and toward a unified, ethical stack. You can start protecting your technical reputation without the bloat of traditional enterprise platforms. It's time to focus on what matters: keeping your services up and your users informed.
Deploy your first monitor and status page in 5 minutes with StatusPulse. Take the first step toward a more reliable and transparent infrastructure today.
Frequently Asked Questions
What is the difference between uptime monitoring and website performance monitoring?
Uptime monitoring is a binary check that determines if your server is reachable and responding with a 200 OK status code. Performance monitoring is qualitative, measuring metrics like Time to First Byte (TTFB), Core Web Vitals, and total page load speed. While uptime tells you if the site is alive, performance monitoring tells you if it's usable for your customers.
How many check locations do I need for accurate website monitoring?
You need at least three distinct geographic locations to ensure data accuracy. Using multiple nodes allows the website monitoring software to use a consensus model, which prevents false alerts caused by a single regional ISP failure. For global applications, we recommend testing from nodes in the EU, US, and Asia to map latency accurately.
Can website monitoring software detect SSL certificate expiration in advance?
Yes, modern tools perform automated TLS handshakes to extract certificate metadata. The system tracks the "Not After" date and triggers alerts at specific intervals, such as 30, 14, and 7 days before expiry. This automation removes the risk of manual tracking errors that lead to embarrassing browser security warnings.
Why should I use a public status page instead of just emailing customers?
A public status page provides a single source of truth that is accessible even if your mail servers are struggling. Emails can be delayed, flagged as spam, or ignored by users who are already frustrated by an outage. A status page reduces the burden on your support team by providing real-time, transparent updates in a central location.
Is AI incident management reliable enough for technical updates?
AI incident management is a highly effective assistant for drafting technical summaries and post-mortems. It excels at parsing logs and identifying patterns, but it's not a replacement for human judgment. We recommend using AI to generate the initial draft of a status update, which a human engineer then reviews for technical accuracy before publishing.
What is the cost difference between StatusPulse and enterprise monitoring tools?
Enterprise tools like Datadog or New Relic often utilize complex, usage-based pricing that scales with your user base or host count. StatusPulse uses a flat-rate model that eliminates the "subscriber tax" often found in the industry. This provides predictable monthly billing for growing teams that need technical depth without corporate price bloat.
Does website monitoring affect my site’s SEO or performance?
The impact on performance is negligible because monitoring requests are lightweight HEAD or GET calls. However, the indirect impact on SEO is significant. Search engines penalize sites with frequent downtime or slow response times, making website monitoring software a critical tool for protecting your organic search rankings.
How do I prevent false positive alerts in my monitoring software?
Preventing false positives requires a multi-region verification logic. Your system should only trigger an alert if multiple check nodes from different geographic regions report a failure simultaneously. This filters out localized network jitter and ensures that your on-call engineers are only woken up for genuine, confirmed outages.


